Live Instruments
EQ Sight includes three real-time instruments that run in the browser on the continuous waveform streamed from the EQ Wave sensor at 32 ksps: an oscilloscope, a spectrum analyzer, and a complex-plane view.
Accessing Live Instruments
On the device page, click Live Instruments. The page opens with the Oscilloscope.
The header bar provides:
| Control | Purpose |
|---|---|
| Oscilloscope / Spectrum Analyzer / Complex Plane | Switch between instruments |
| Pause / Resume | Freeze or resume the display |
| Channel buttons (VA VB VC · IN · IA IB IC) | Select channels |
| Triggered / Free-Running | Capture mode (oscilloscope) |
| Metrics | Show or hide the metrics panel (oscilloscope) |
| Resolution (Auto, 5 Hz, 1 Hz) | Frequency resolution (spectrum analyzer and complex plane) |
| Waterfall / Slide | Spectrogram layout (spectrum analyzer) |
| Two status lights | Left: green when the display is phase-locked to the signal. Right: stream connection (green connected, yellow connecting, red disconnected). |
Only the selected channels are streamed from the gateway.
Oscilloscope
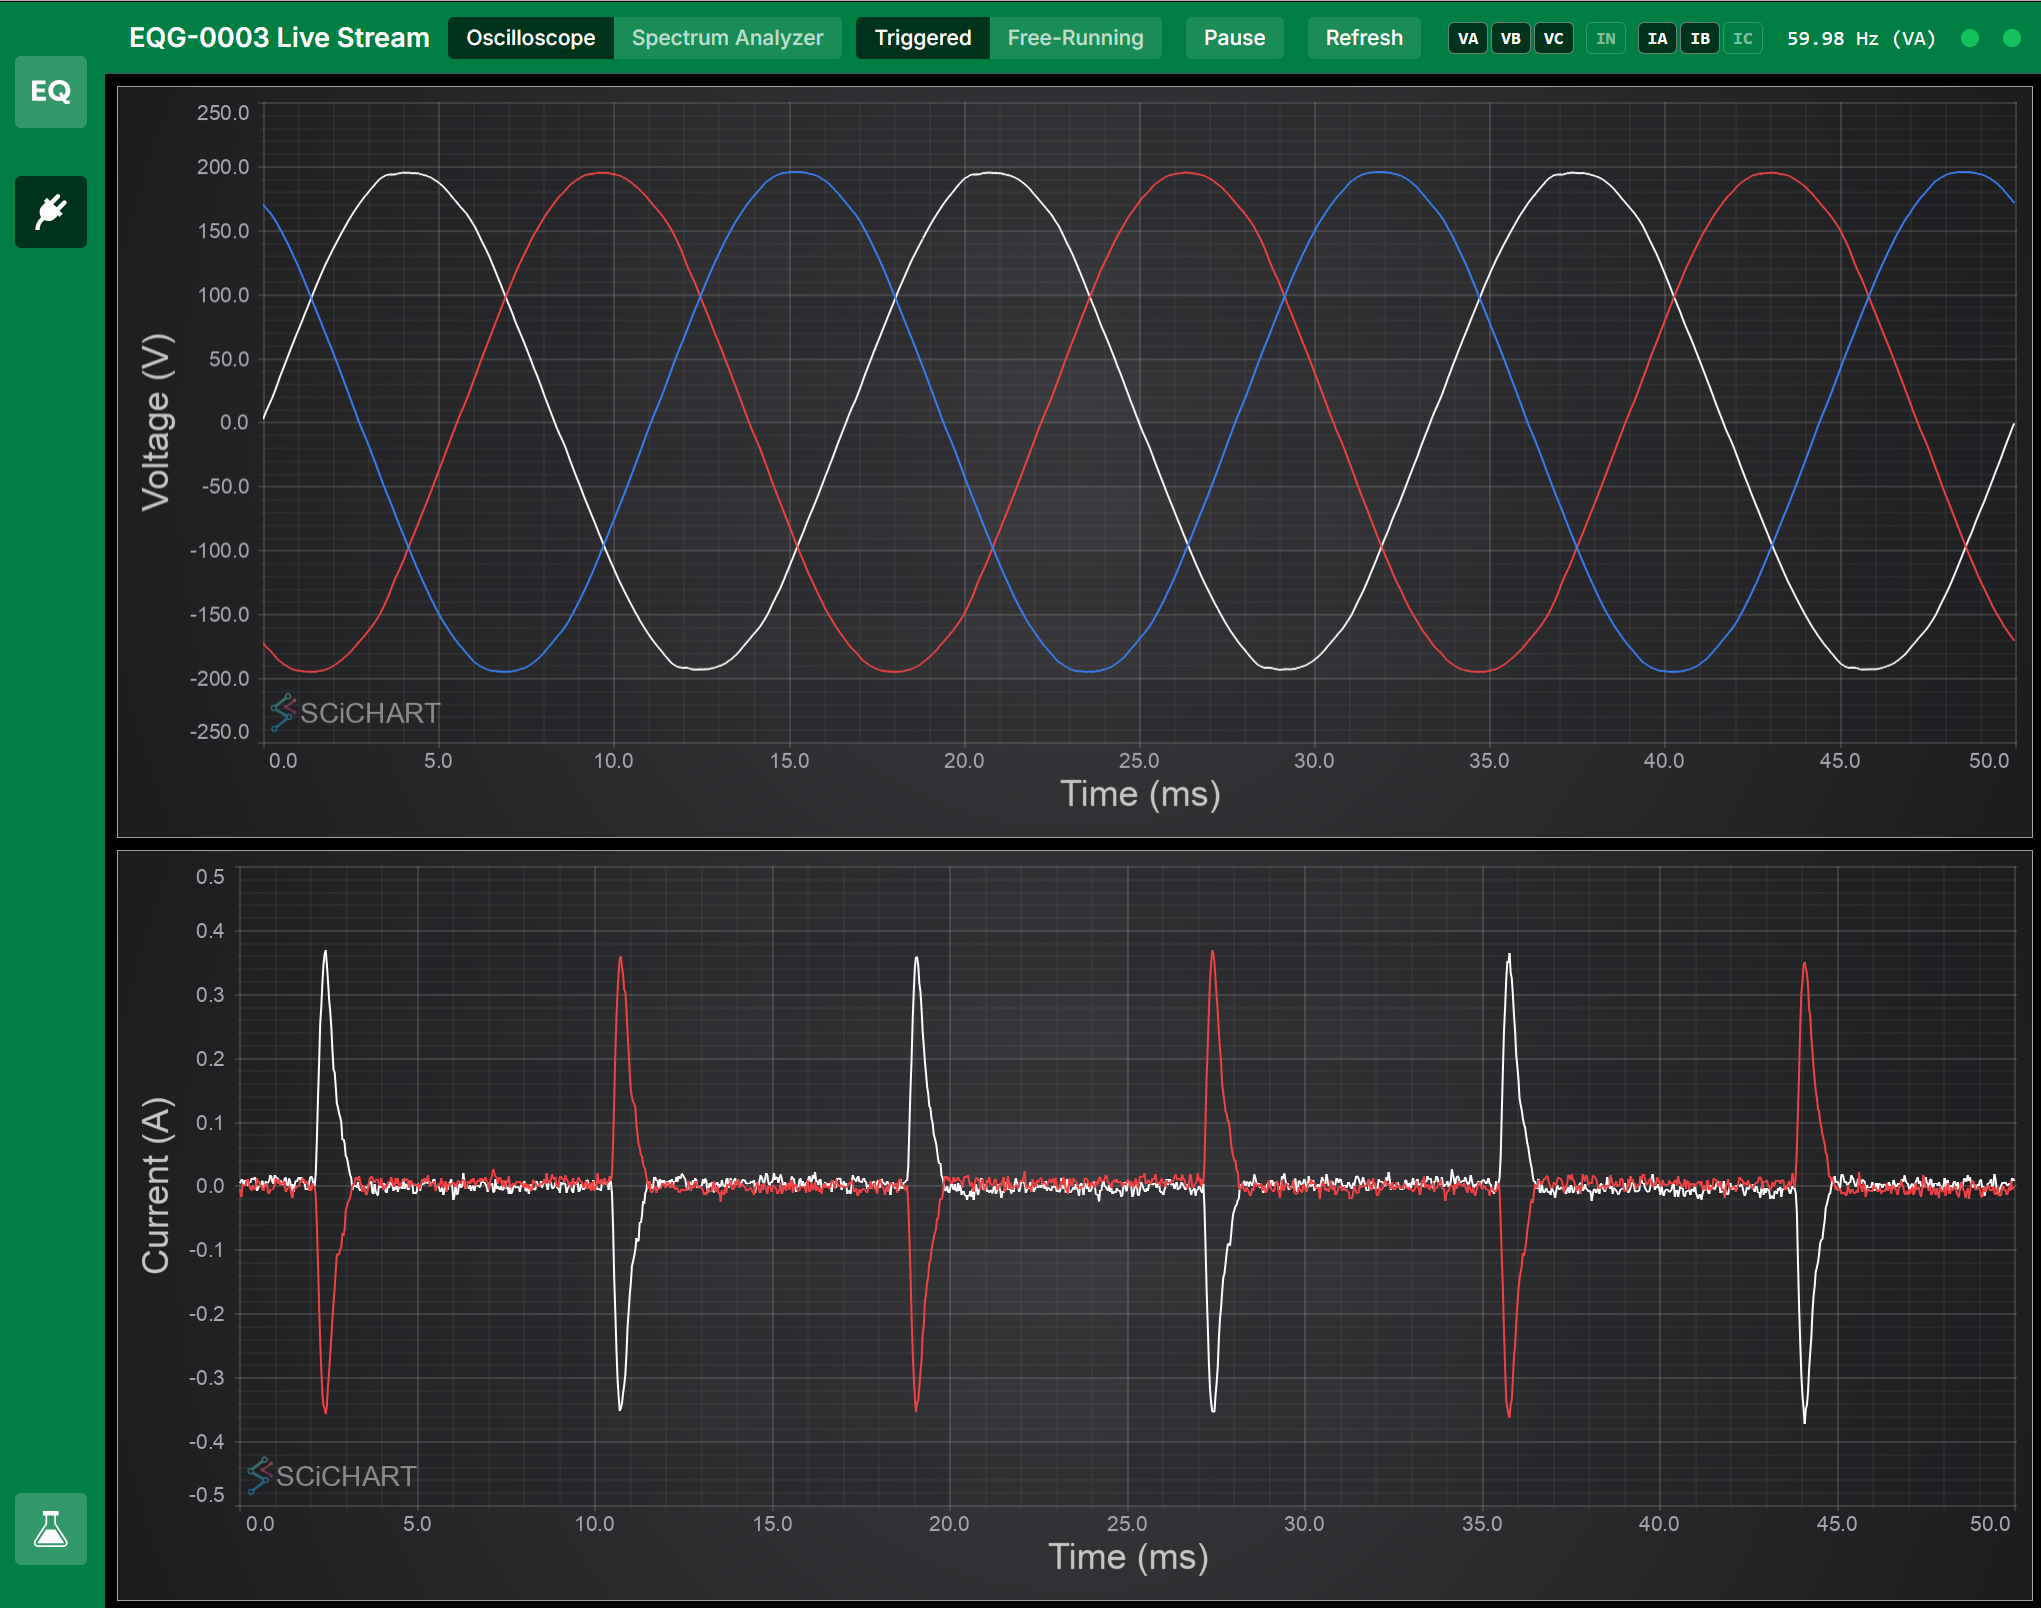
Voltage channels appear in the upper chart and current channels in the lower chart. Click channel buttons to show or hide individual channels; several can be active at once.
Triggered aligns each sweep to a cycle boundary of the phase-locked fundamental, producing a stable, oscilloscope-like view. Scroll the mouse wheel over the chart to change the number of cycles shown (1 to 50). Without phase lock (no AC reference, or the sensor offline), the display falls back to Free-Running and returns to Triggered once lock holds.
Free-Running shows a continuous rolling window of the waveform; the mouse wheel zooms the time span.
Scroll the mouse wheel over a vertical axis to zoom it; double-click to return to automatic scaling.
Metrics panel
The panel beside the charts shows, for all channels:
- Frequency, with the reference channel it is measured on.
- Phasors: the fundamental of each voltage and current channel.
- Per-channel table: total RMS, THD, and phase angle relative to the reference.
- Power: real (P), reactive (Q) and apparent (S) power and power factor for each phase.
Spectrum Analyzer
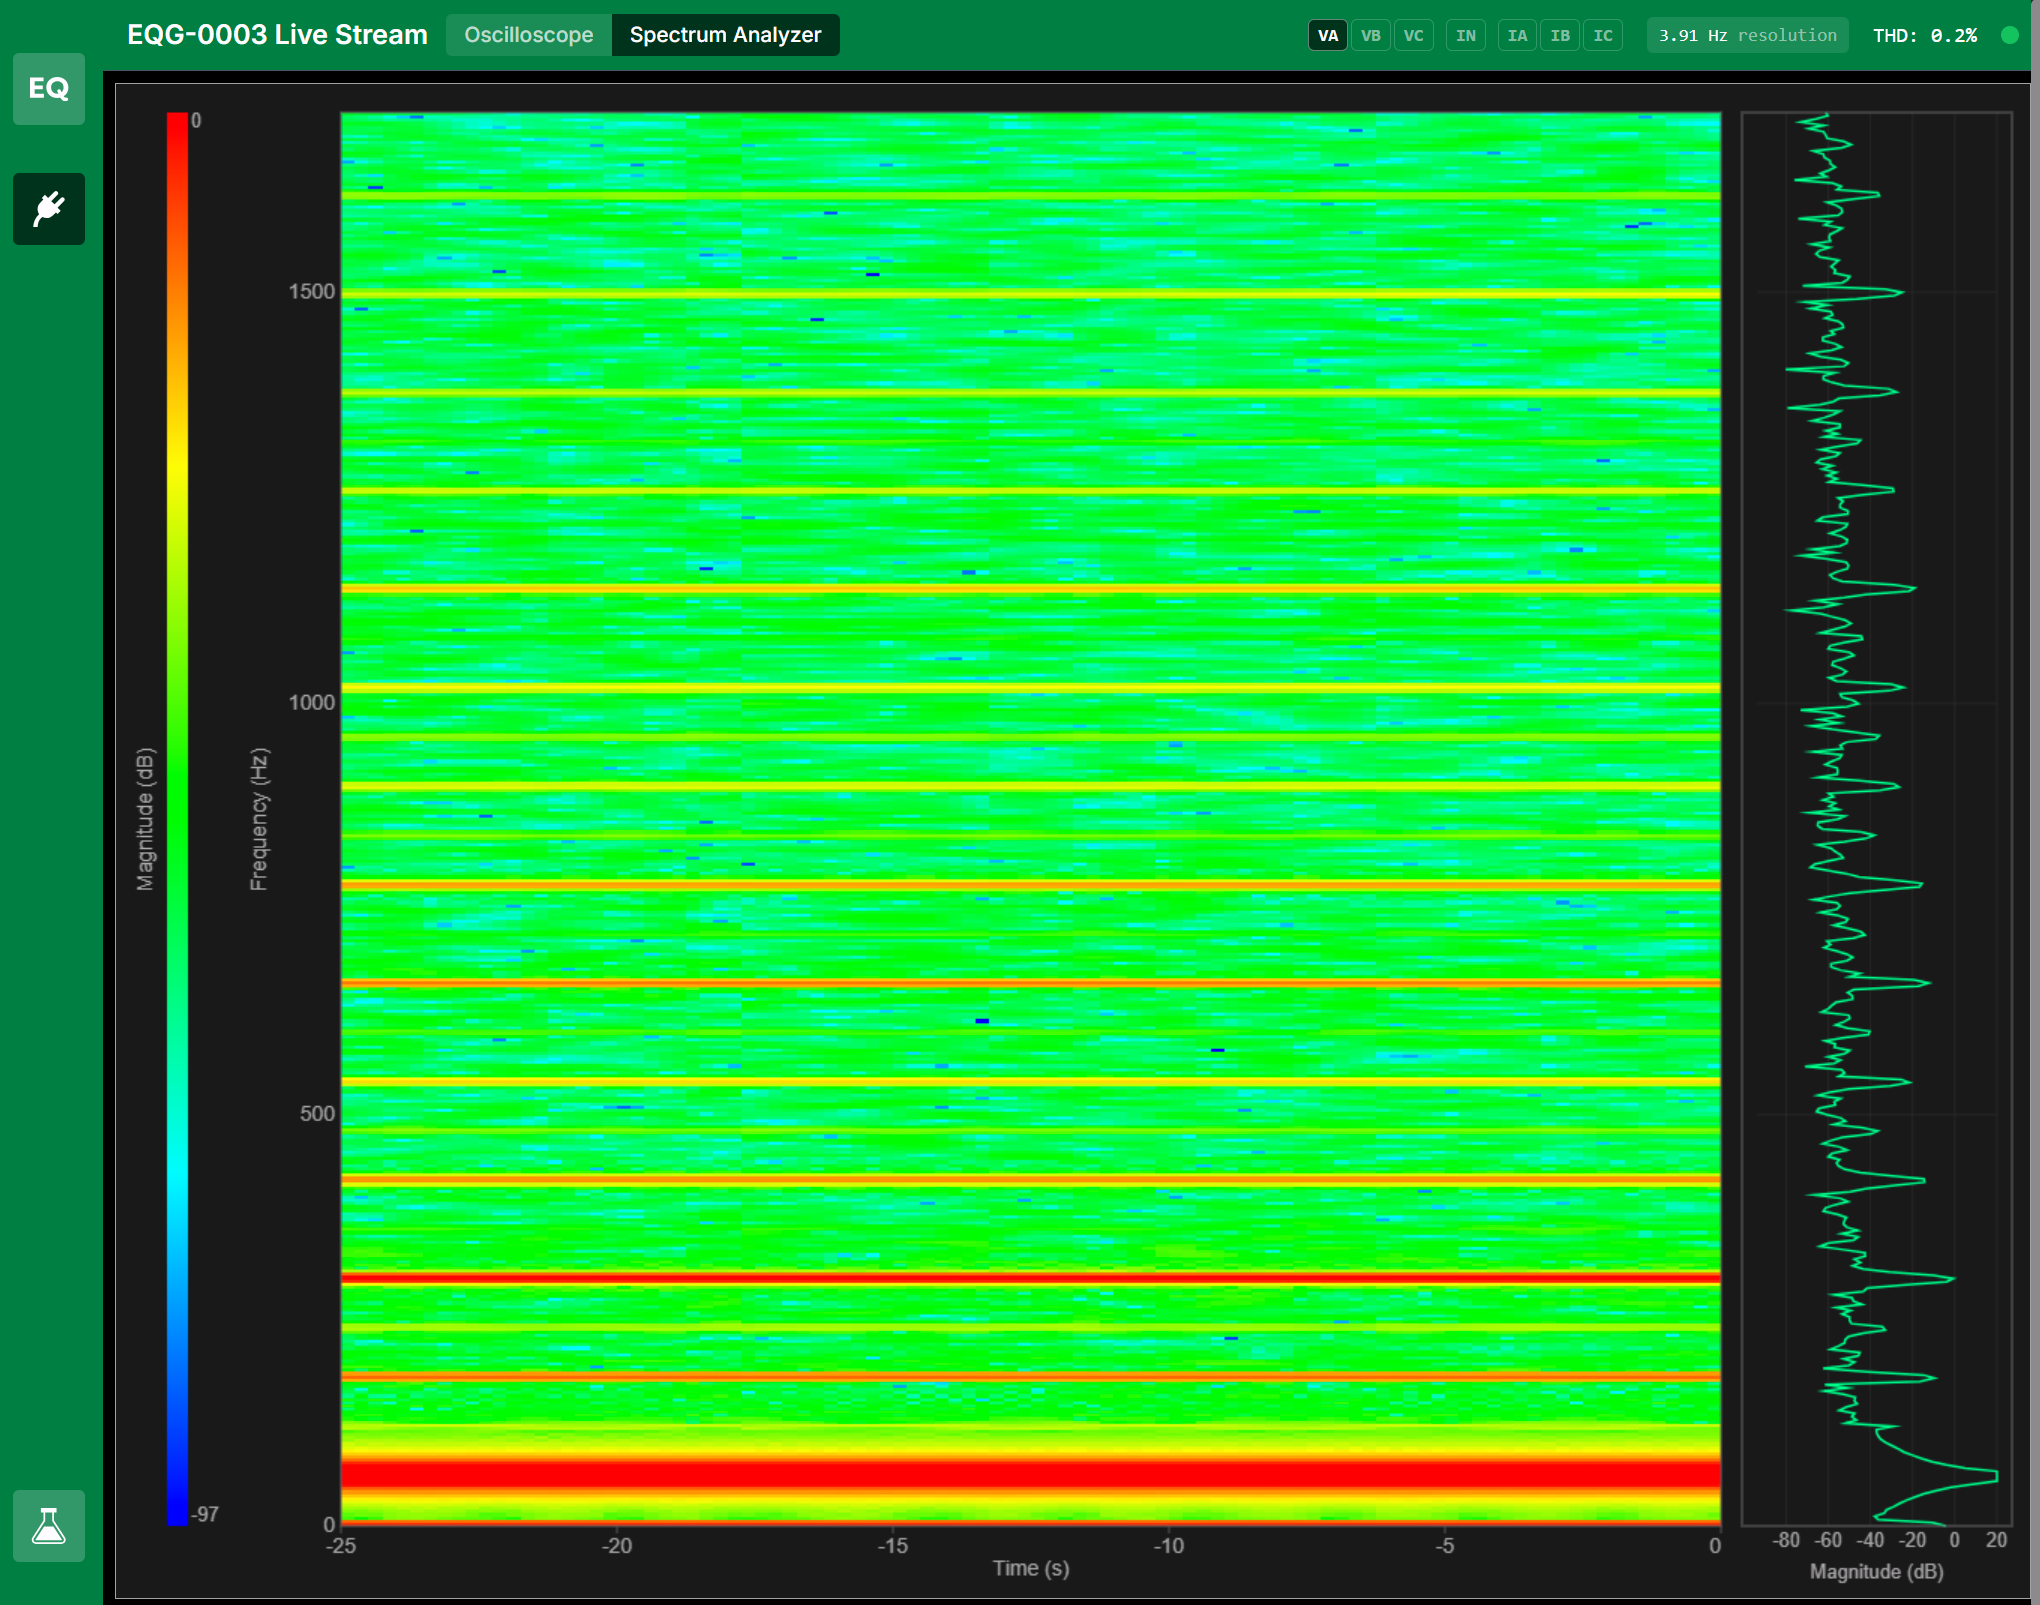
The spectrum analyzer shows a real-time spectrogram of one channel. The spectrum line above it is the latest FFT, marked with harmonic numbers (H10, H20, …); the waterfall below shows magnitude in dB over the last several seconds. The header shows the channel’s THD.
Channel buttons are single-select in this mode; only the selected channel is analyzed and streamed.
- Waterfall places frequency on the horizontal axis with time scrolling down; Slide places time on the horizontal axis and frequency on the vertical axis.
- Frequency range: scroll the mouse wheel over the frequency axis to zoom. The range always starts at 0 Hz and extends from 200 Hz up to 8 kHz; it opens at 3.84 kHz, the 64th harmonic of 60 Hz.
- Resolution: click to cycle. Auto chooses the finest resolution the zoomed range can display, down to 0.2 Hz. 5 Hz and 1 Hz fix it. Finer resolution uses a longer analysis window and updates more slowly. If the browser cannot keep up, the resolution is reduced automatically and the header shows reduced (CPU).
FFT windows are aligned to whole cycles of the phase-locked fundamental, so harmonics fall on exact bins.
Complex Plane
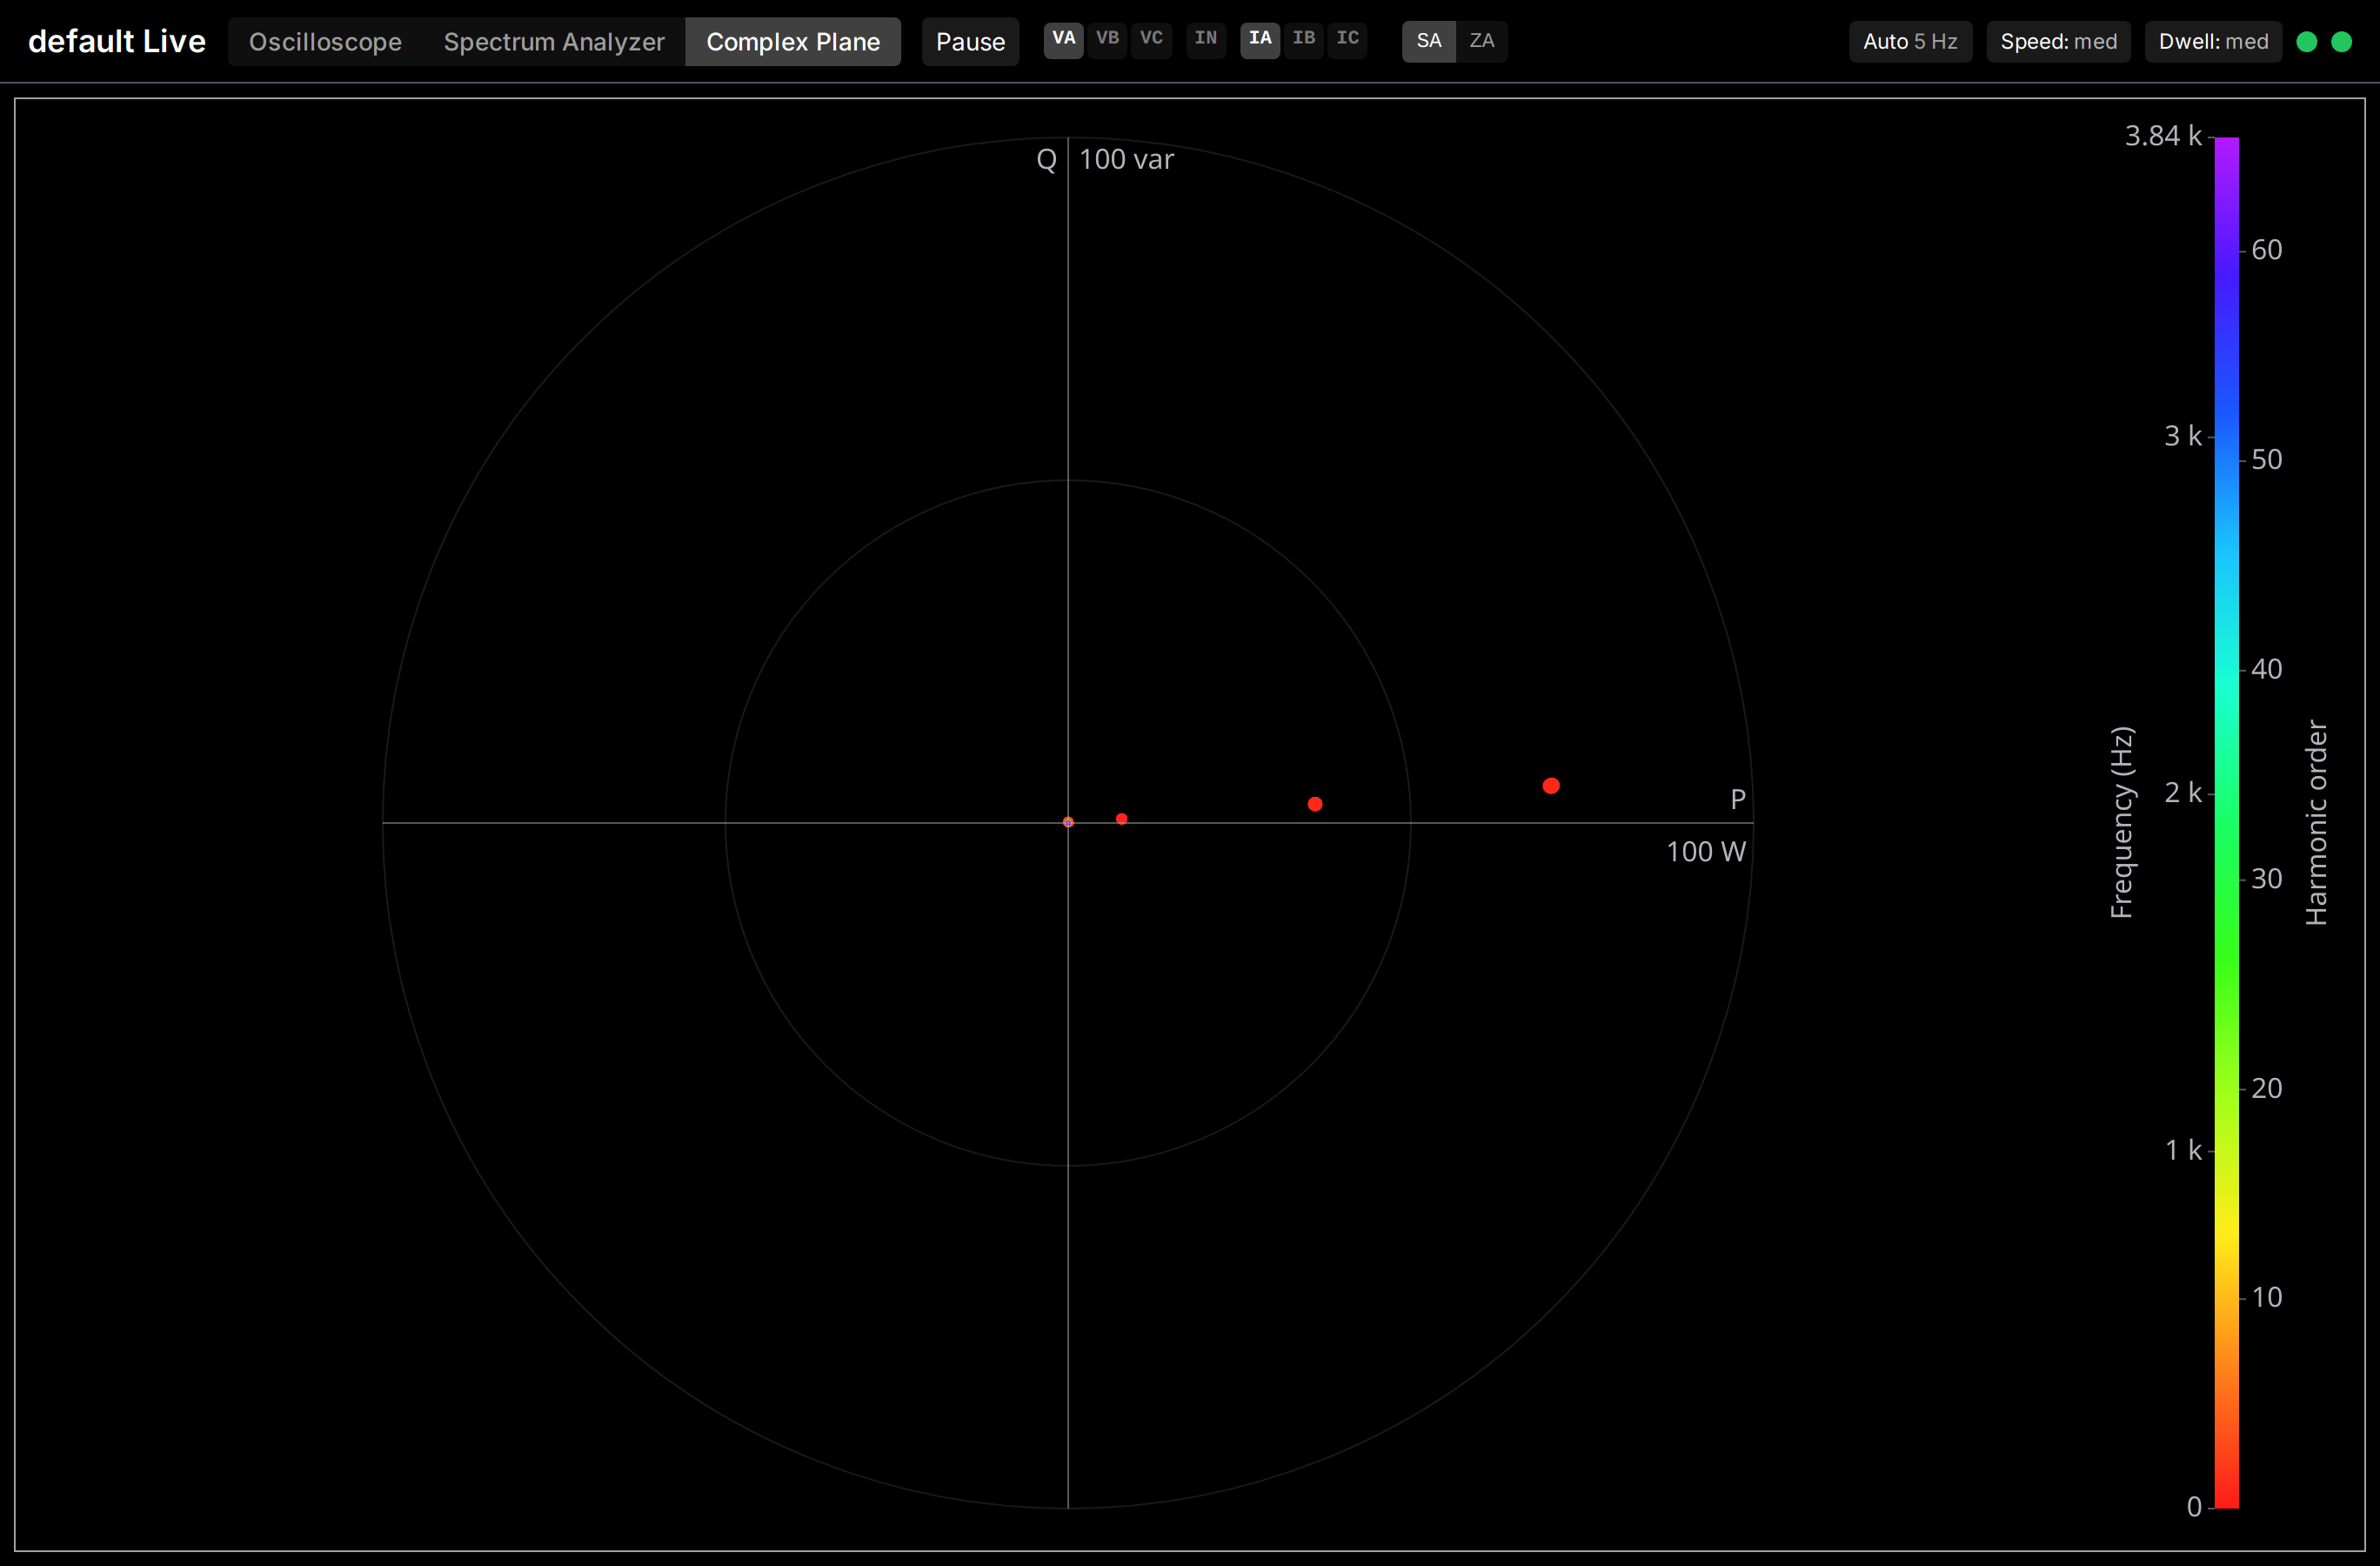
The complex plane plots, for one phase, either the complex power S = V·I* (horizontal axis P, vertical axis Q) or the impedance Z = V/I at the fundamental and each harmonic. Points are colored by frequency and harmonic order (scale at right). The estimate is passive: it uses the voltage and current already present, so harmonics appear only where the load draws harmonic current.
- Channel buttons select the phase; the voltage and current of that phase are used together.
- S / Z selects complex power or impedance.
- Speed sets how quickly the estimate tracks changes (fast is responsive but noisier; slow is smoother).
- Dwell sets how long each point remains on screen. It affects the display only.
Side-by-Side Operation
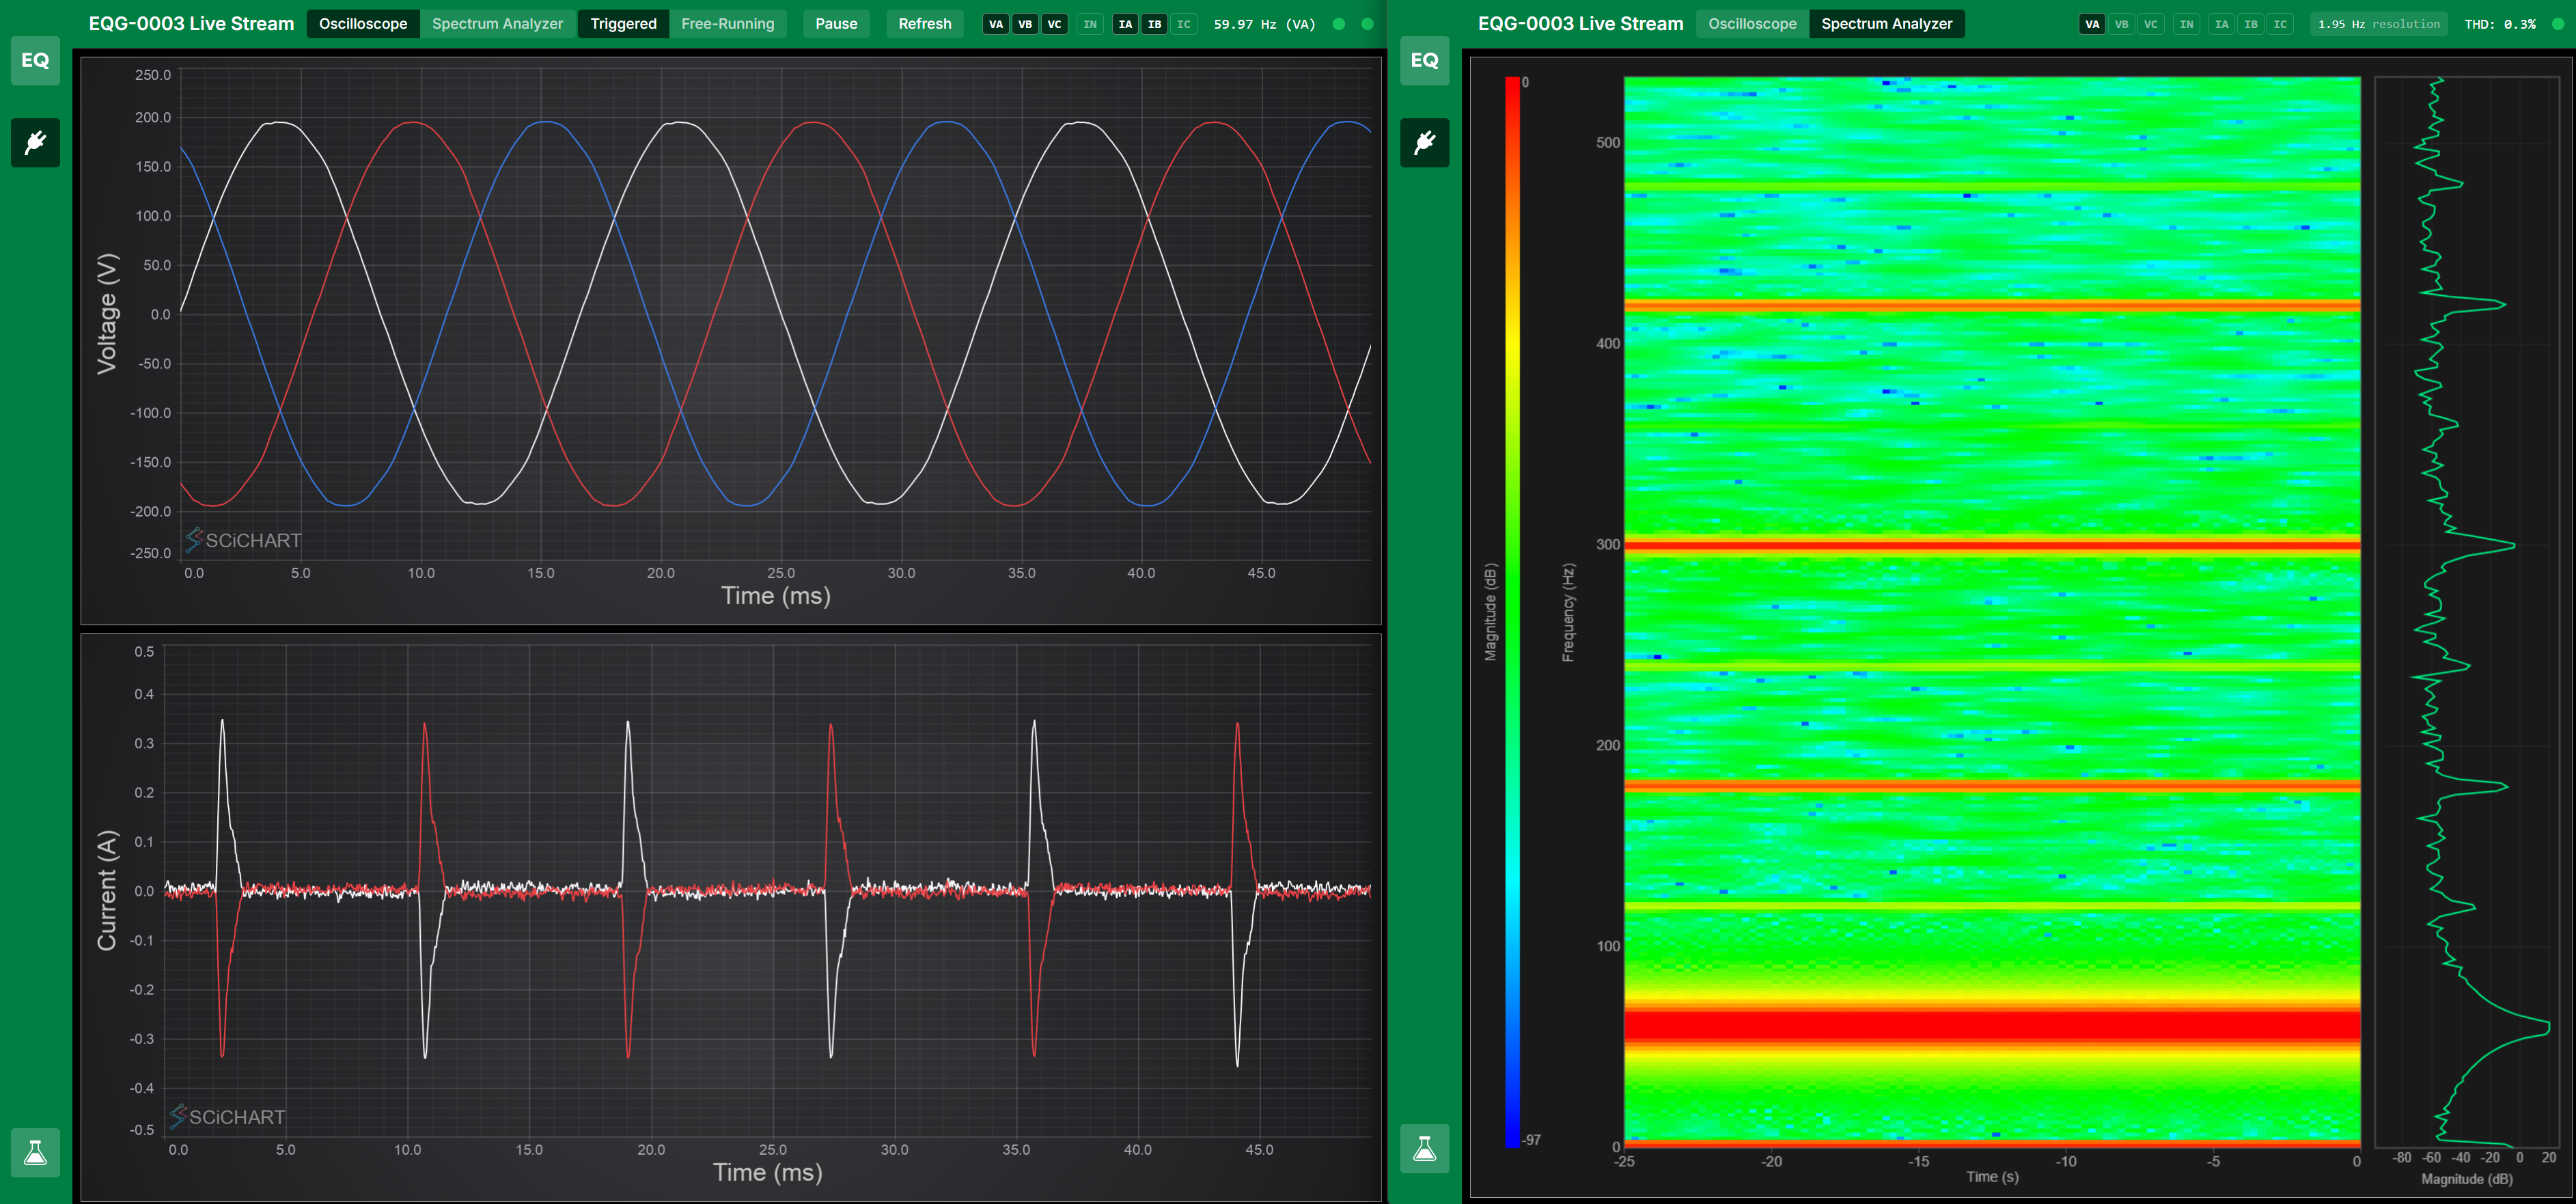
Instruments can run in separate browser windows or tabs at the same time, streaming from the same device.
URL State
Instrument settings are kept in the page URL, so a view can be bookmarked or shared:
mode=triggered,free-running,spectrogramornyquist(complex plane)channels=VA,IA(one channel in the spectrum analyzer)cycles=5(triggered cycle count)fftRes=auto,5or1, andfreqMax=3840(spectrum analyzer and complex plane)layout=waterfallorslide(spectrum analyzer)metrics=0(metrics panel hidden)