EQ Sight — Devices
The plug icon in the sidebar opens the device page for the EQ Wave sensor connected to the gateway. From there you reach historical analysis and the live instruments.
Device Page
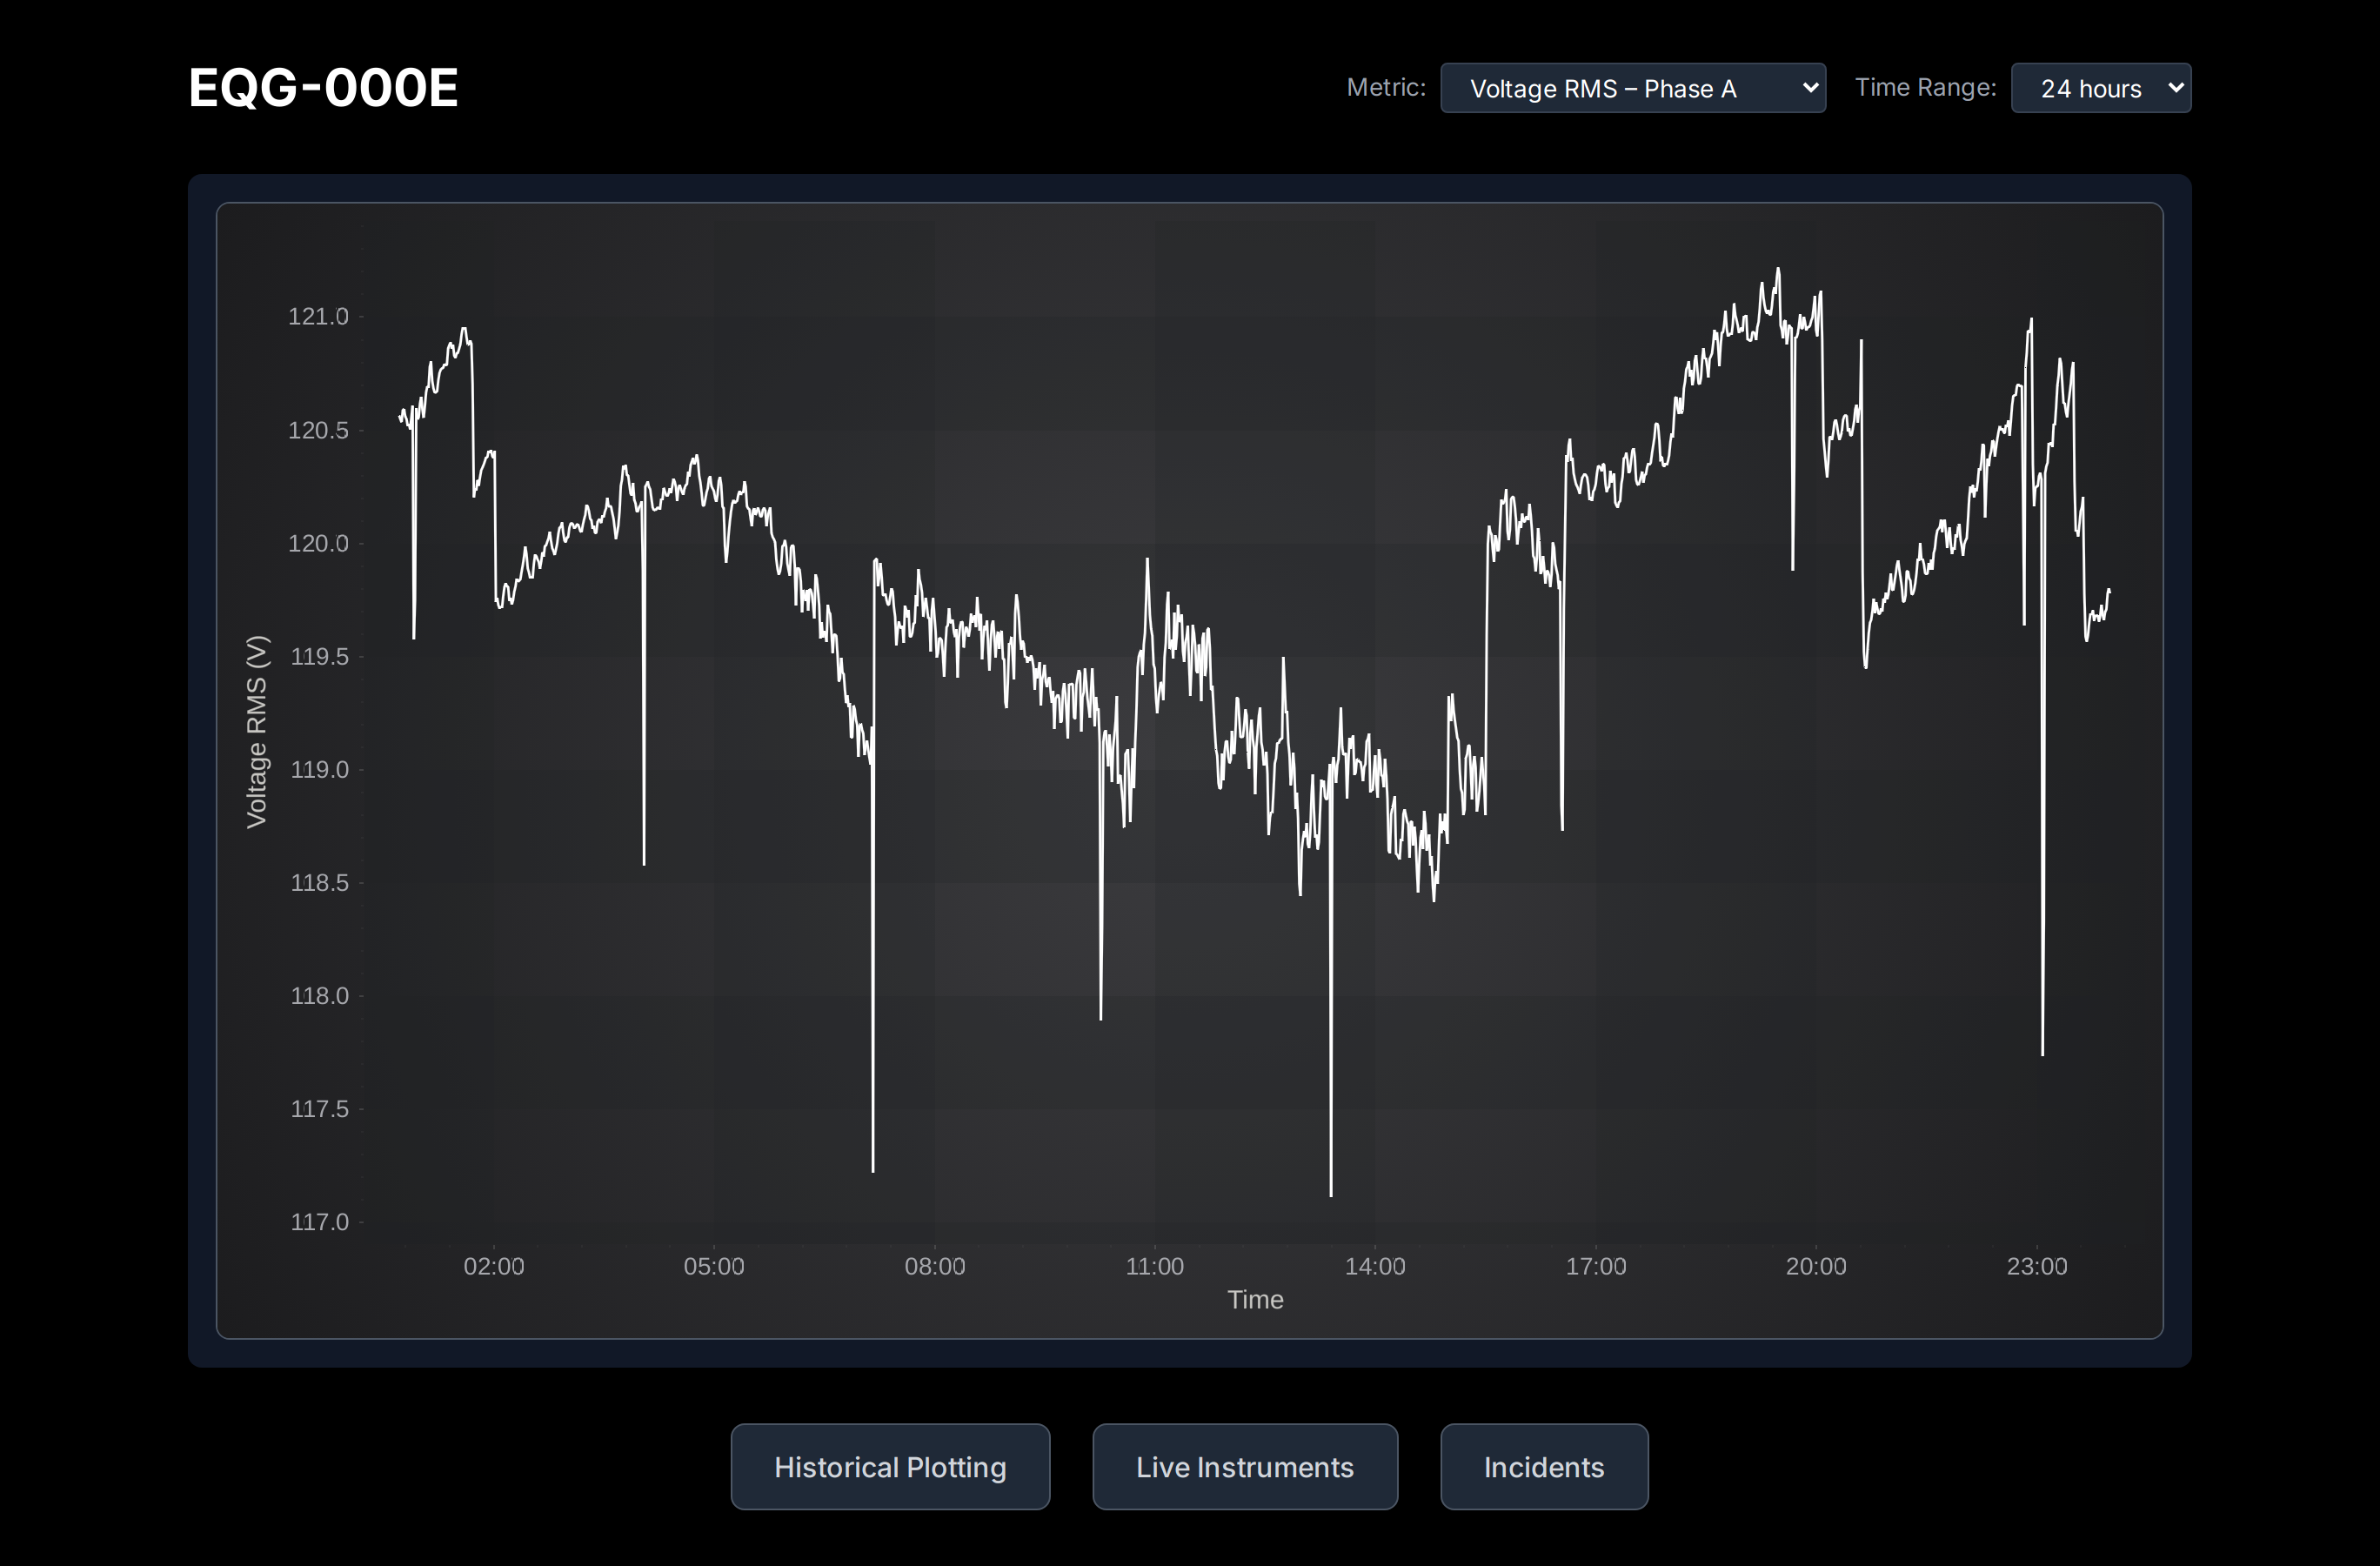
The page is titled with the gateway’s hostname and plots one metric over a recent window. Use Metric to choose the quantity (for example, Voltage RMS for one phase) and Time Range to choose 1, 6 or 24 hours.
- Historical Plotting opens Power Quality Analysis on stored data.
- Live Instruments opens the live instruments.
Power Quality Analysis
The analysis page plots stored data from the gateway. EQ Wave records two streams, and the page reads both:
- Metrics: RMS voltage and current, power, frequency, THD and power factor, one record every 200 ms. The left panel labels this source Power Monitor.
- CPOW: the raw Continuous Point-on-Wave waveform, 7 channels at 32 ksps.
Five buttons at the top of the left panel select the view. The header carries the time zone toggle and Export, which saves the chart on screen as PNG, JPEG or SVG (the SVG embeds the chart image rather than vector paths). A status bar under the chart shows the time range, point count, view and data source.
Explorer
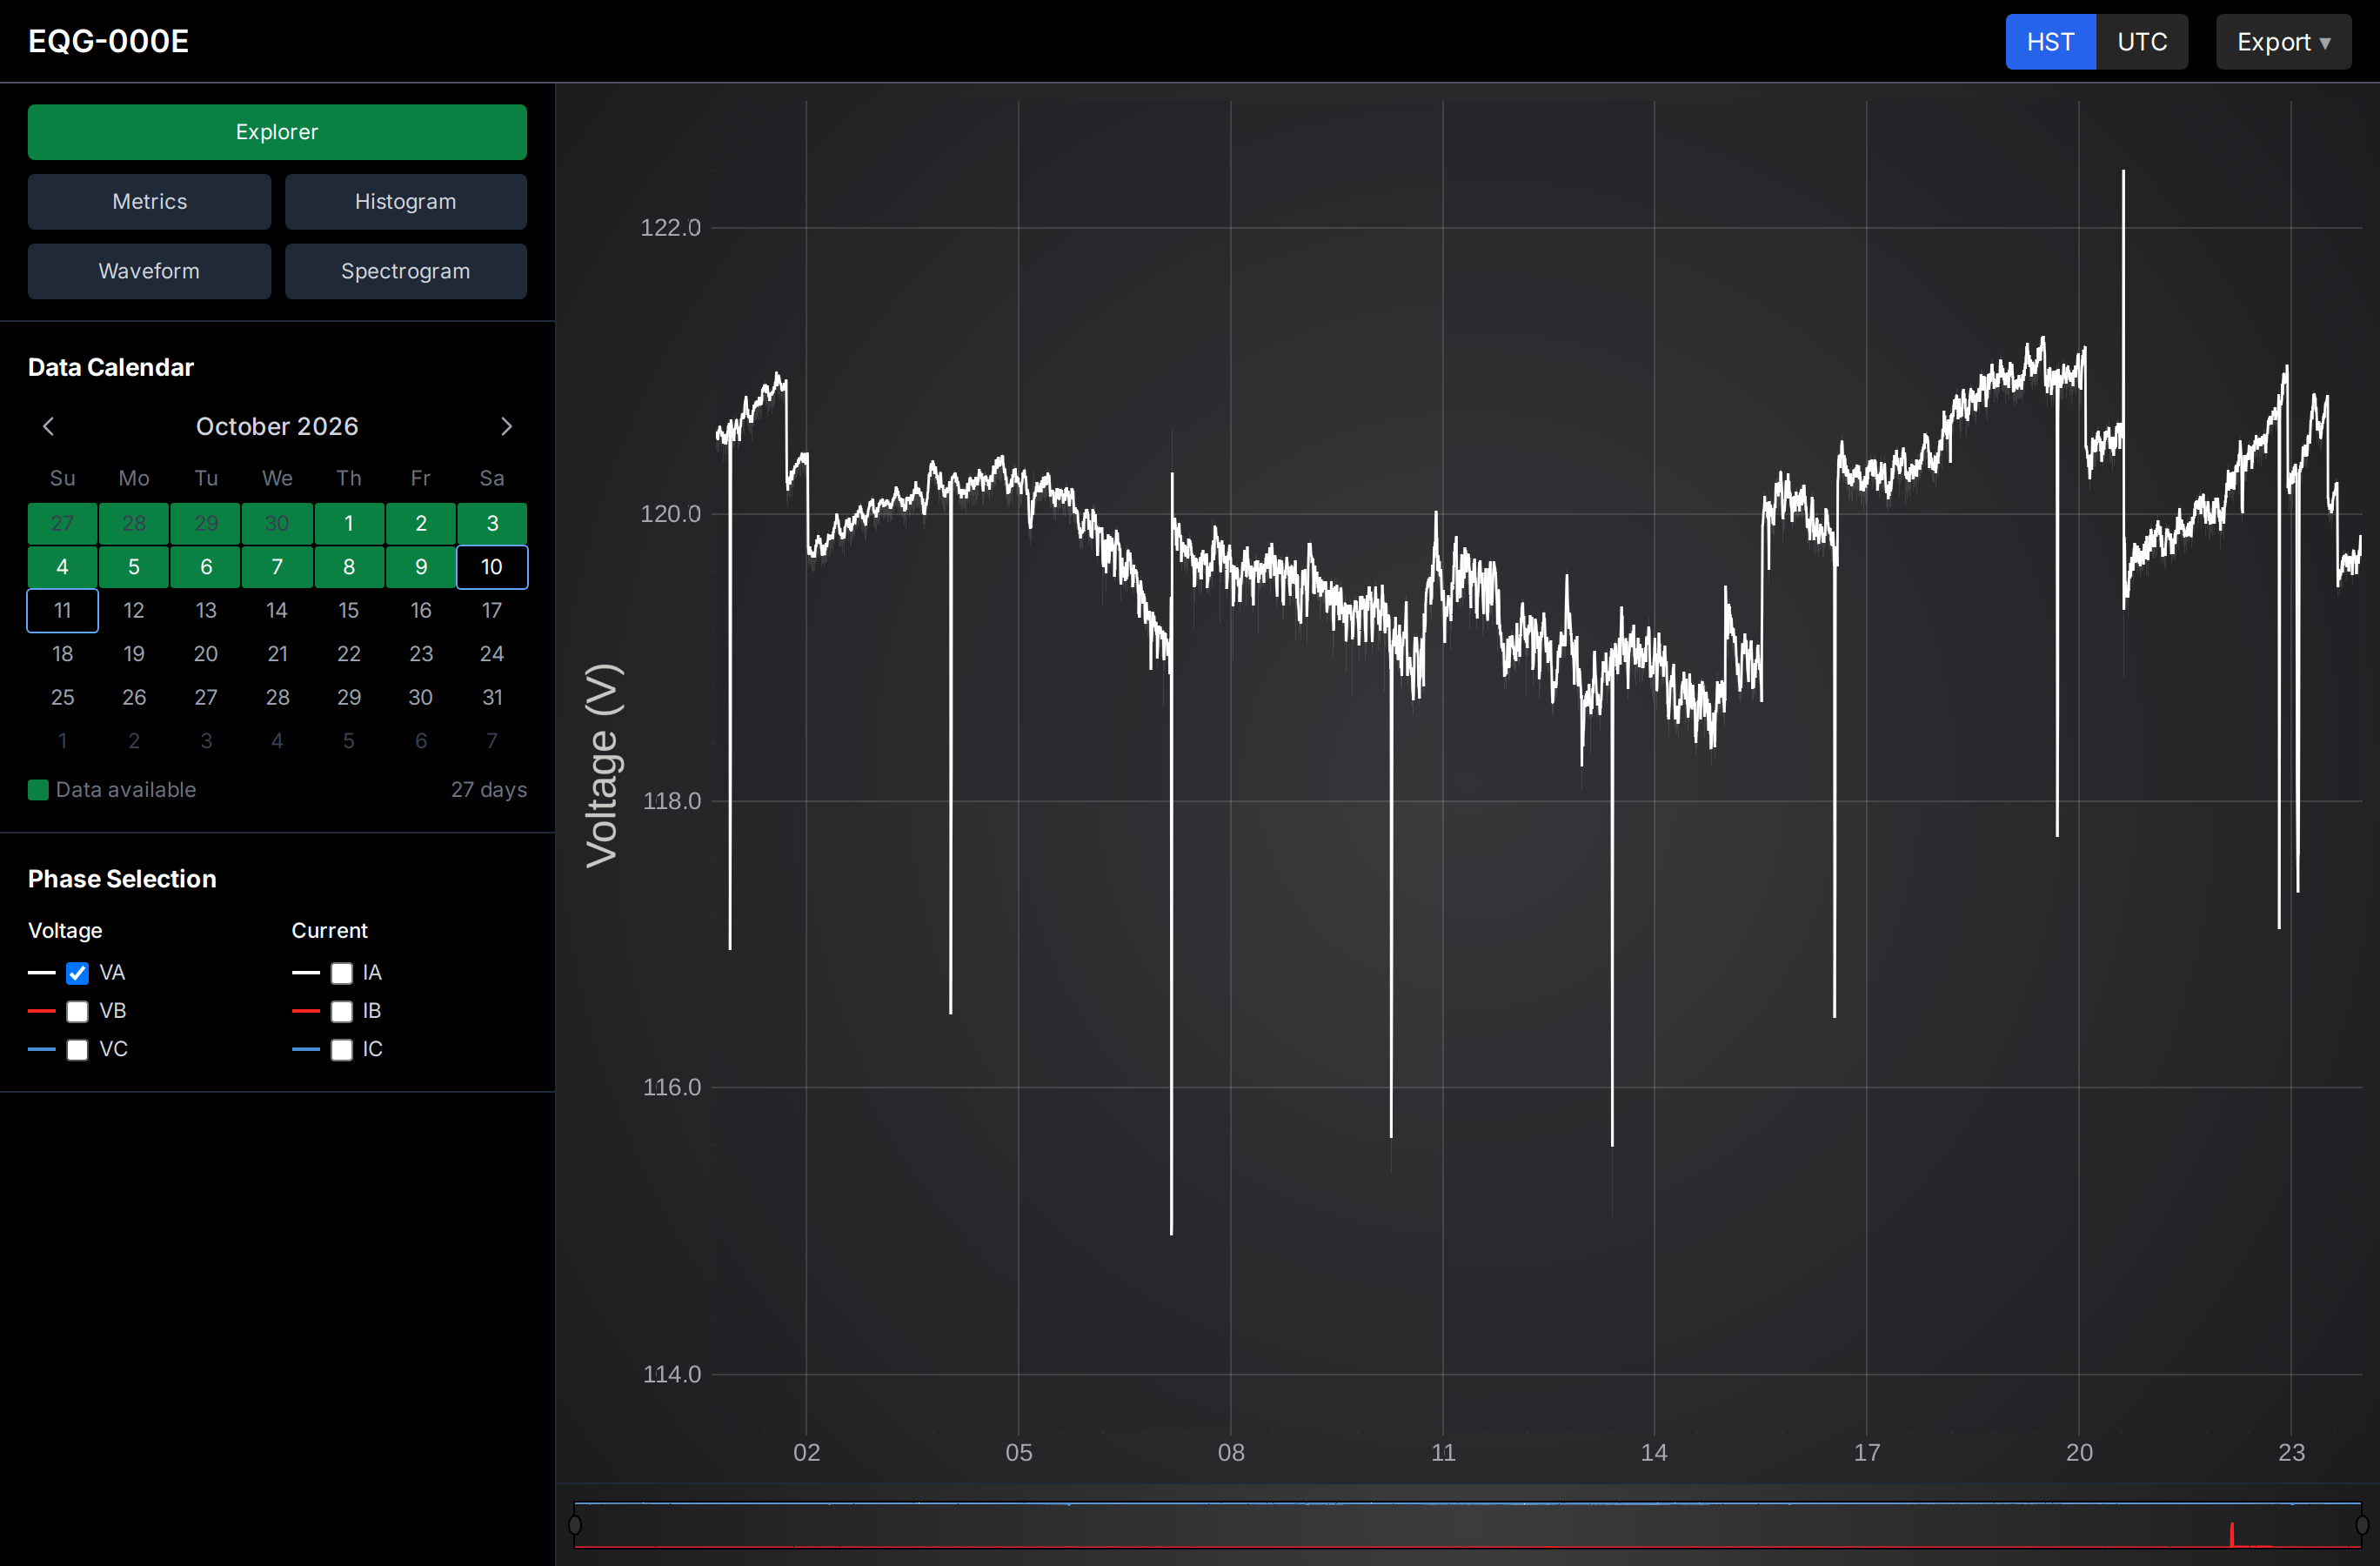
Explorer is a continuous zoom across both streams. It opens on the last 24 hours of RMS values from the metrics stream; as you zoom below about 40 cycles on screen, the CPOW waveform fades in, and below about 10 cycles only the waveform is shown. Zoom with the mouse wheel over the chart, and move the window with the overview strip beneath it.
- Data Calendar: days with stored data are shaded green. Select days to set the range.
- Phase Selection: choose which voltage (VA, VB, VC) and current (IA, IB, IC) channels to plot.
Metrics
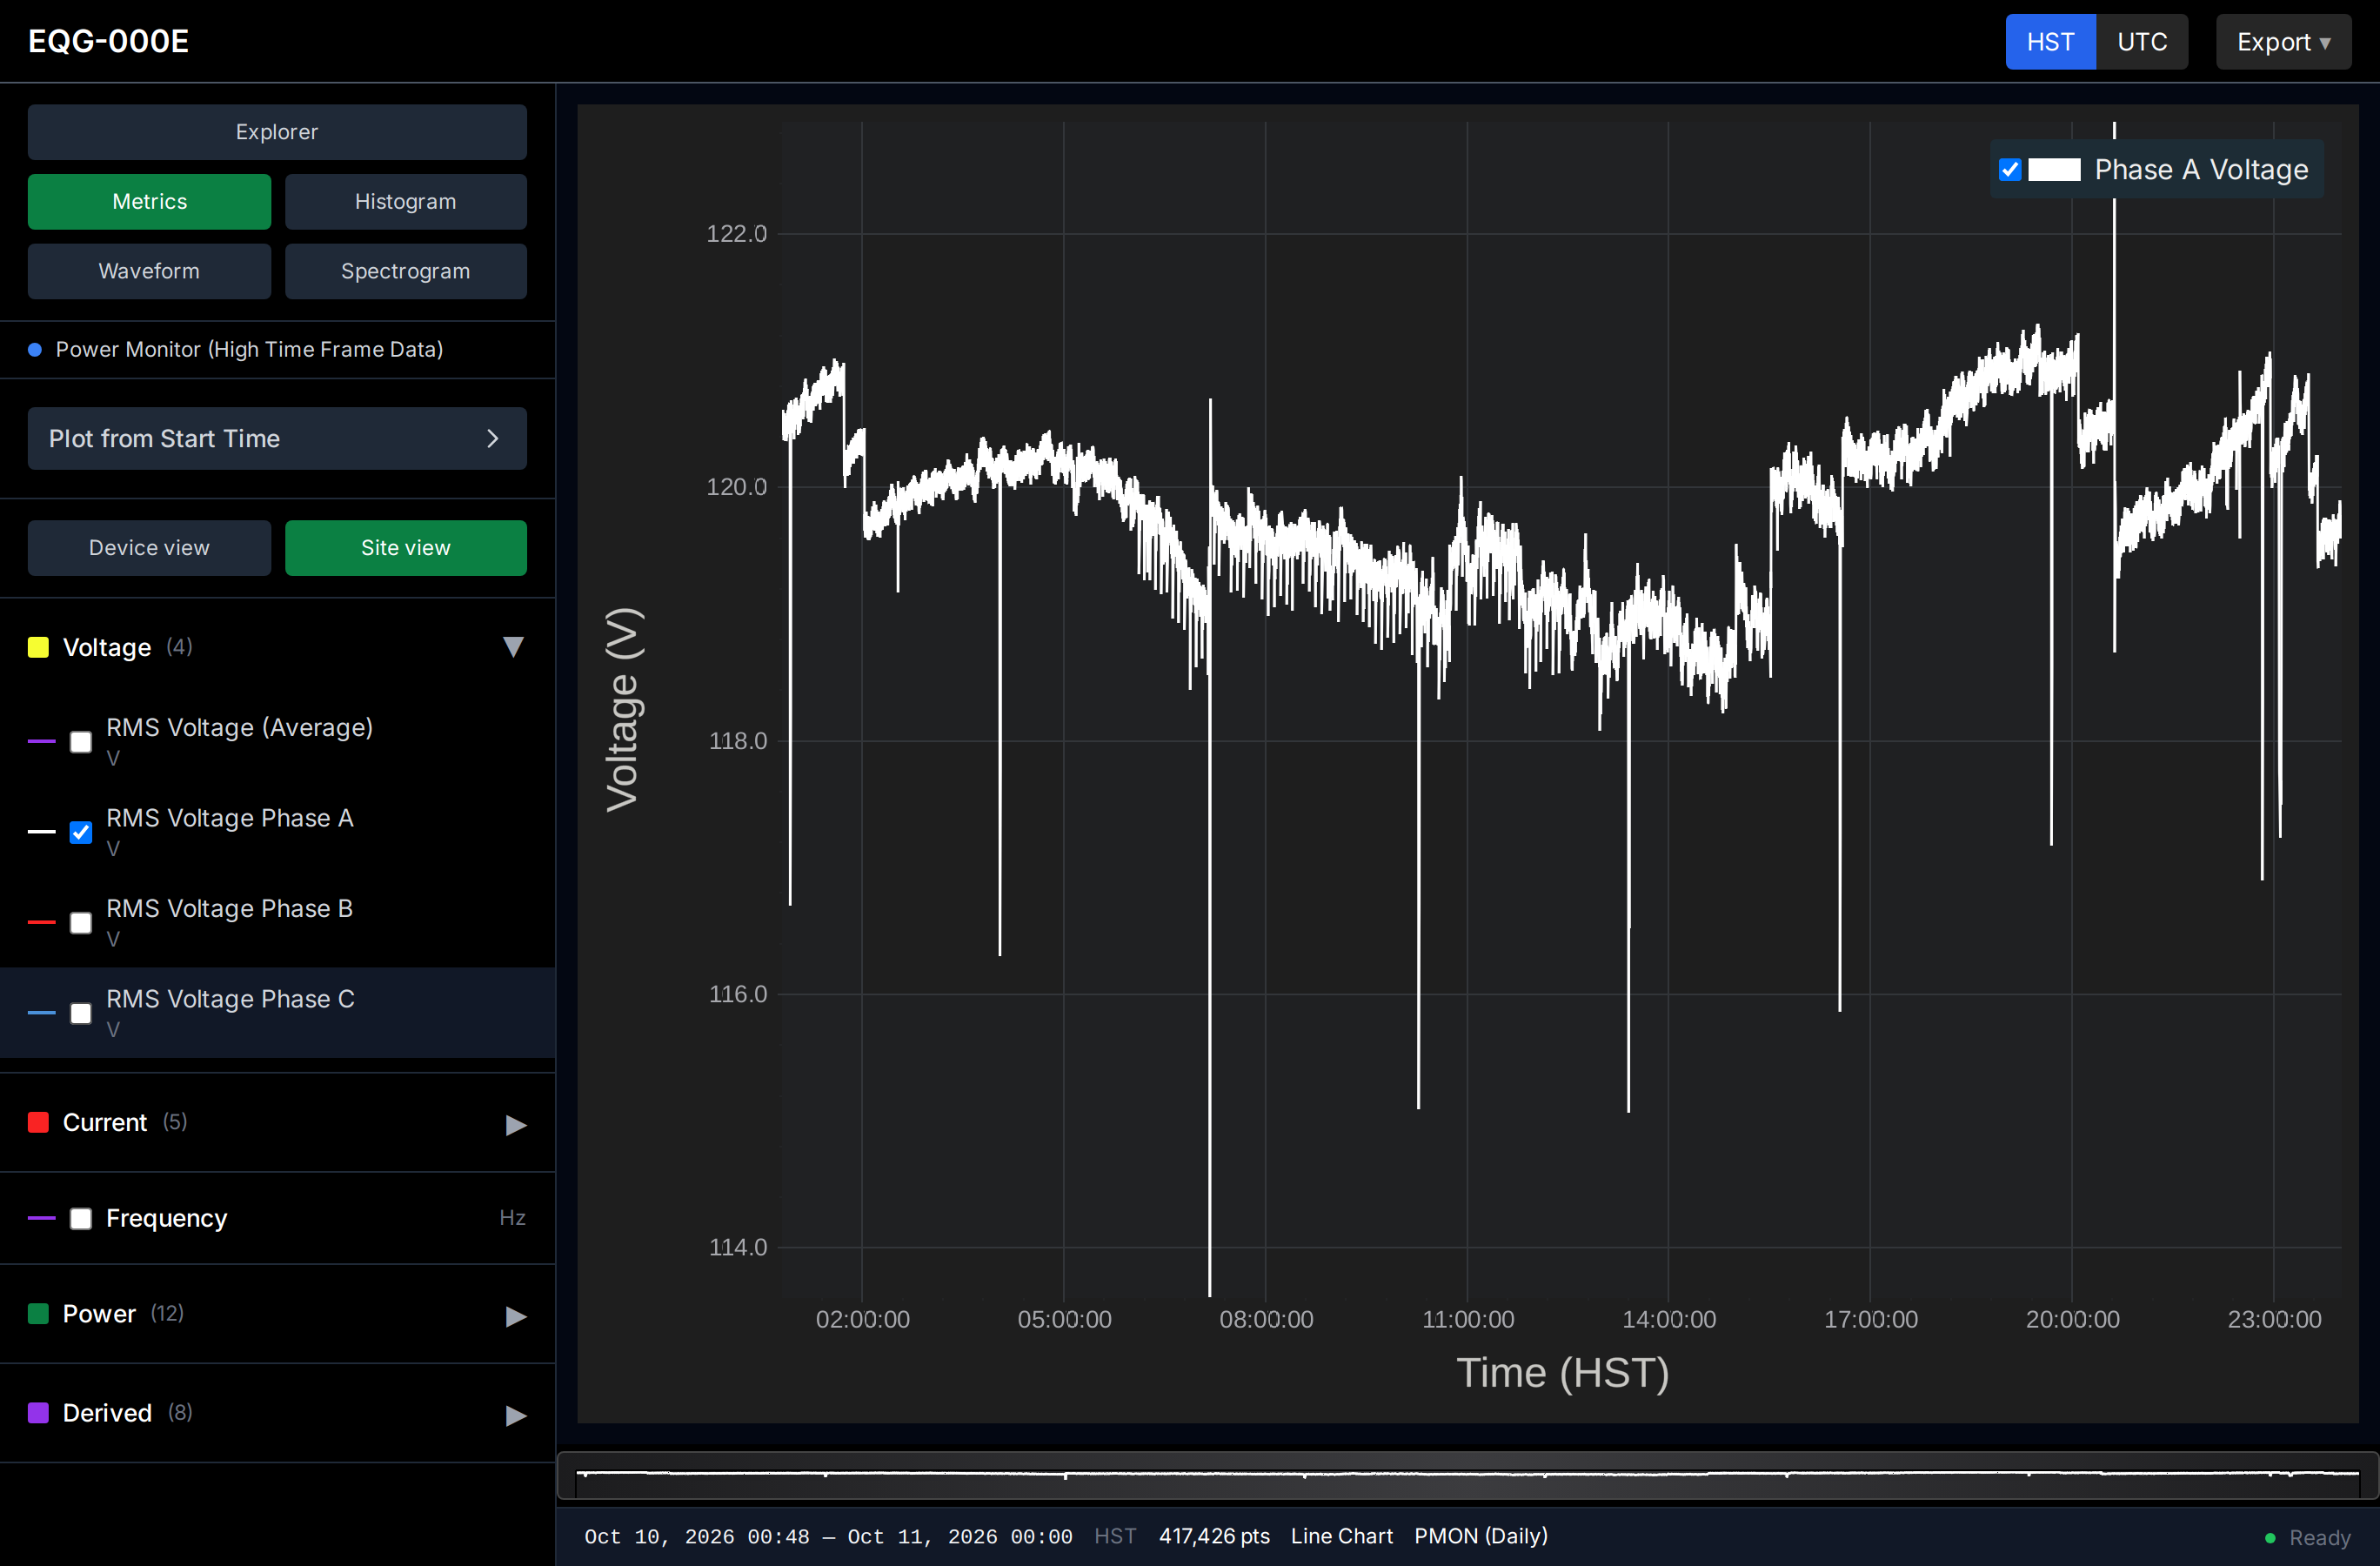
Time-series plots of the metrics stream. Metrics are grouped by category (Voltage, Current, Frequency, Power, Derived); tick any combination to overlay them, and toggle individual series in the chart legend. Site view lists metrics by quantity and channel; Device view groups the same metrics by load as defined in the site profile. Plot from Start Time loads a specific stored file.
Histogram
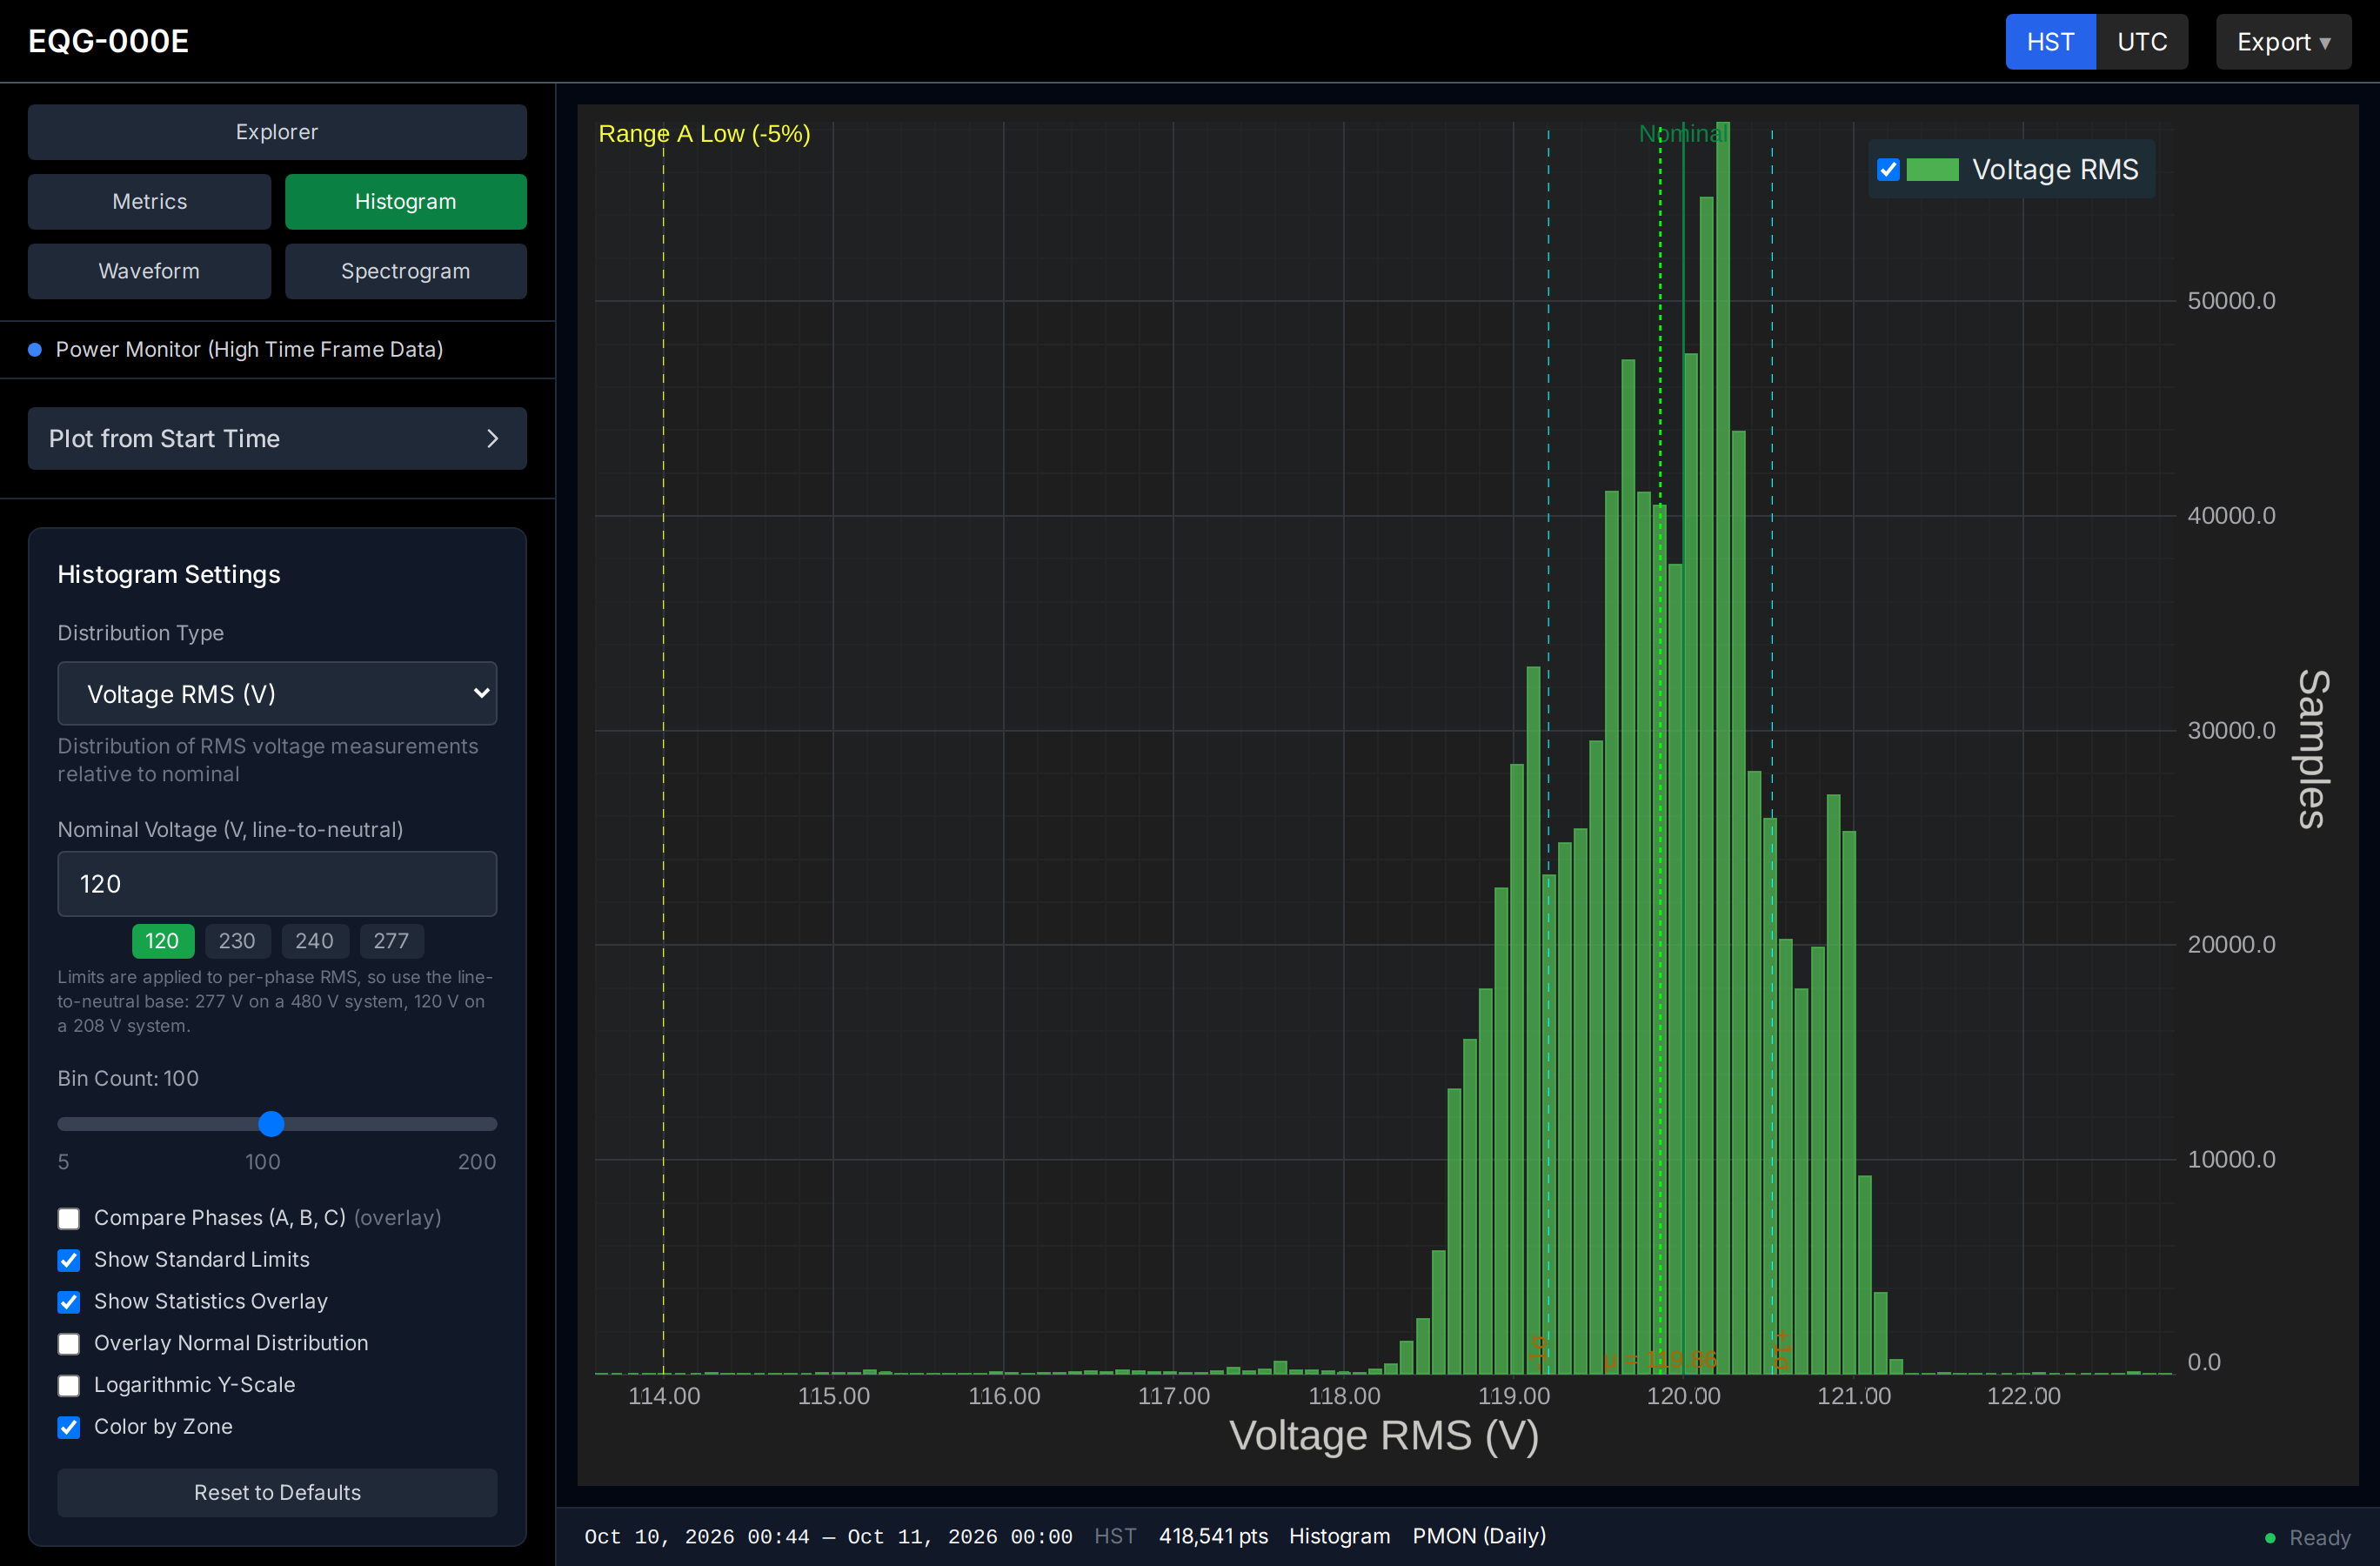
The distribution of one metric over the selected range. Distribution Type selects Voltage RMS, Current RMS, Real Power, Reactive, Apparent, Power Factor, Load Factor or Frequency. For voltage, set the nominal line-to-neutral voltage (120, 230, 240 or 277 V presets, or any value); limits apply to per-phase RMS. Options overlay the phases, standard limits, a statistics overlay and a fitted normal distribution, and switch to a logarithmic count axis.
Waveform
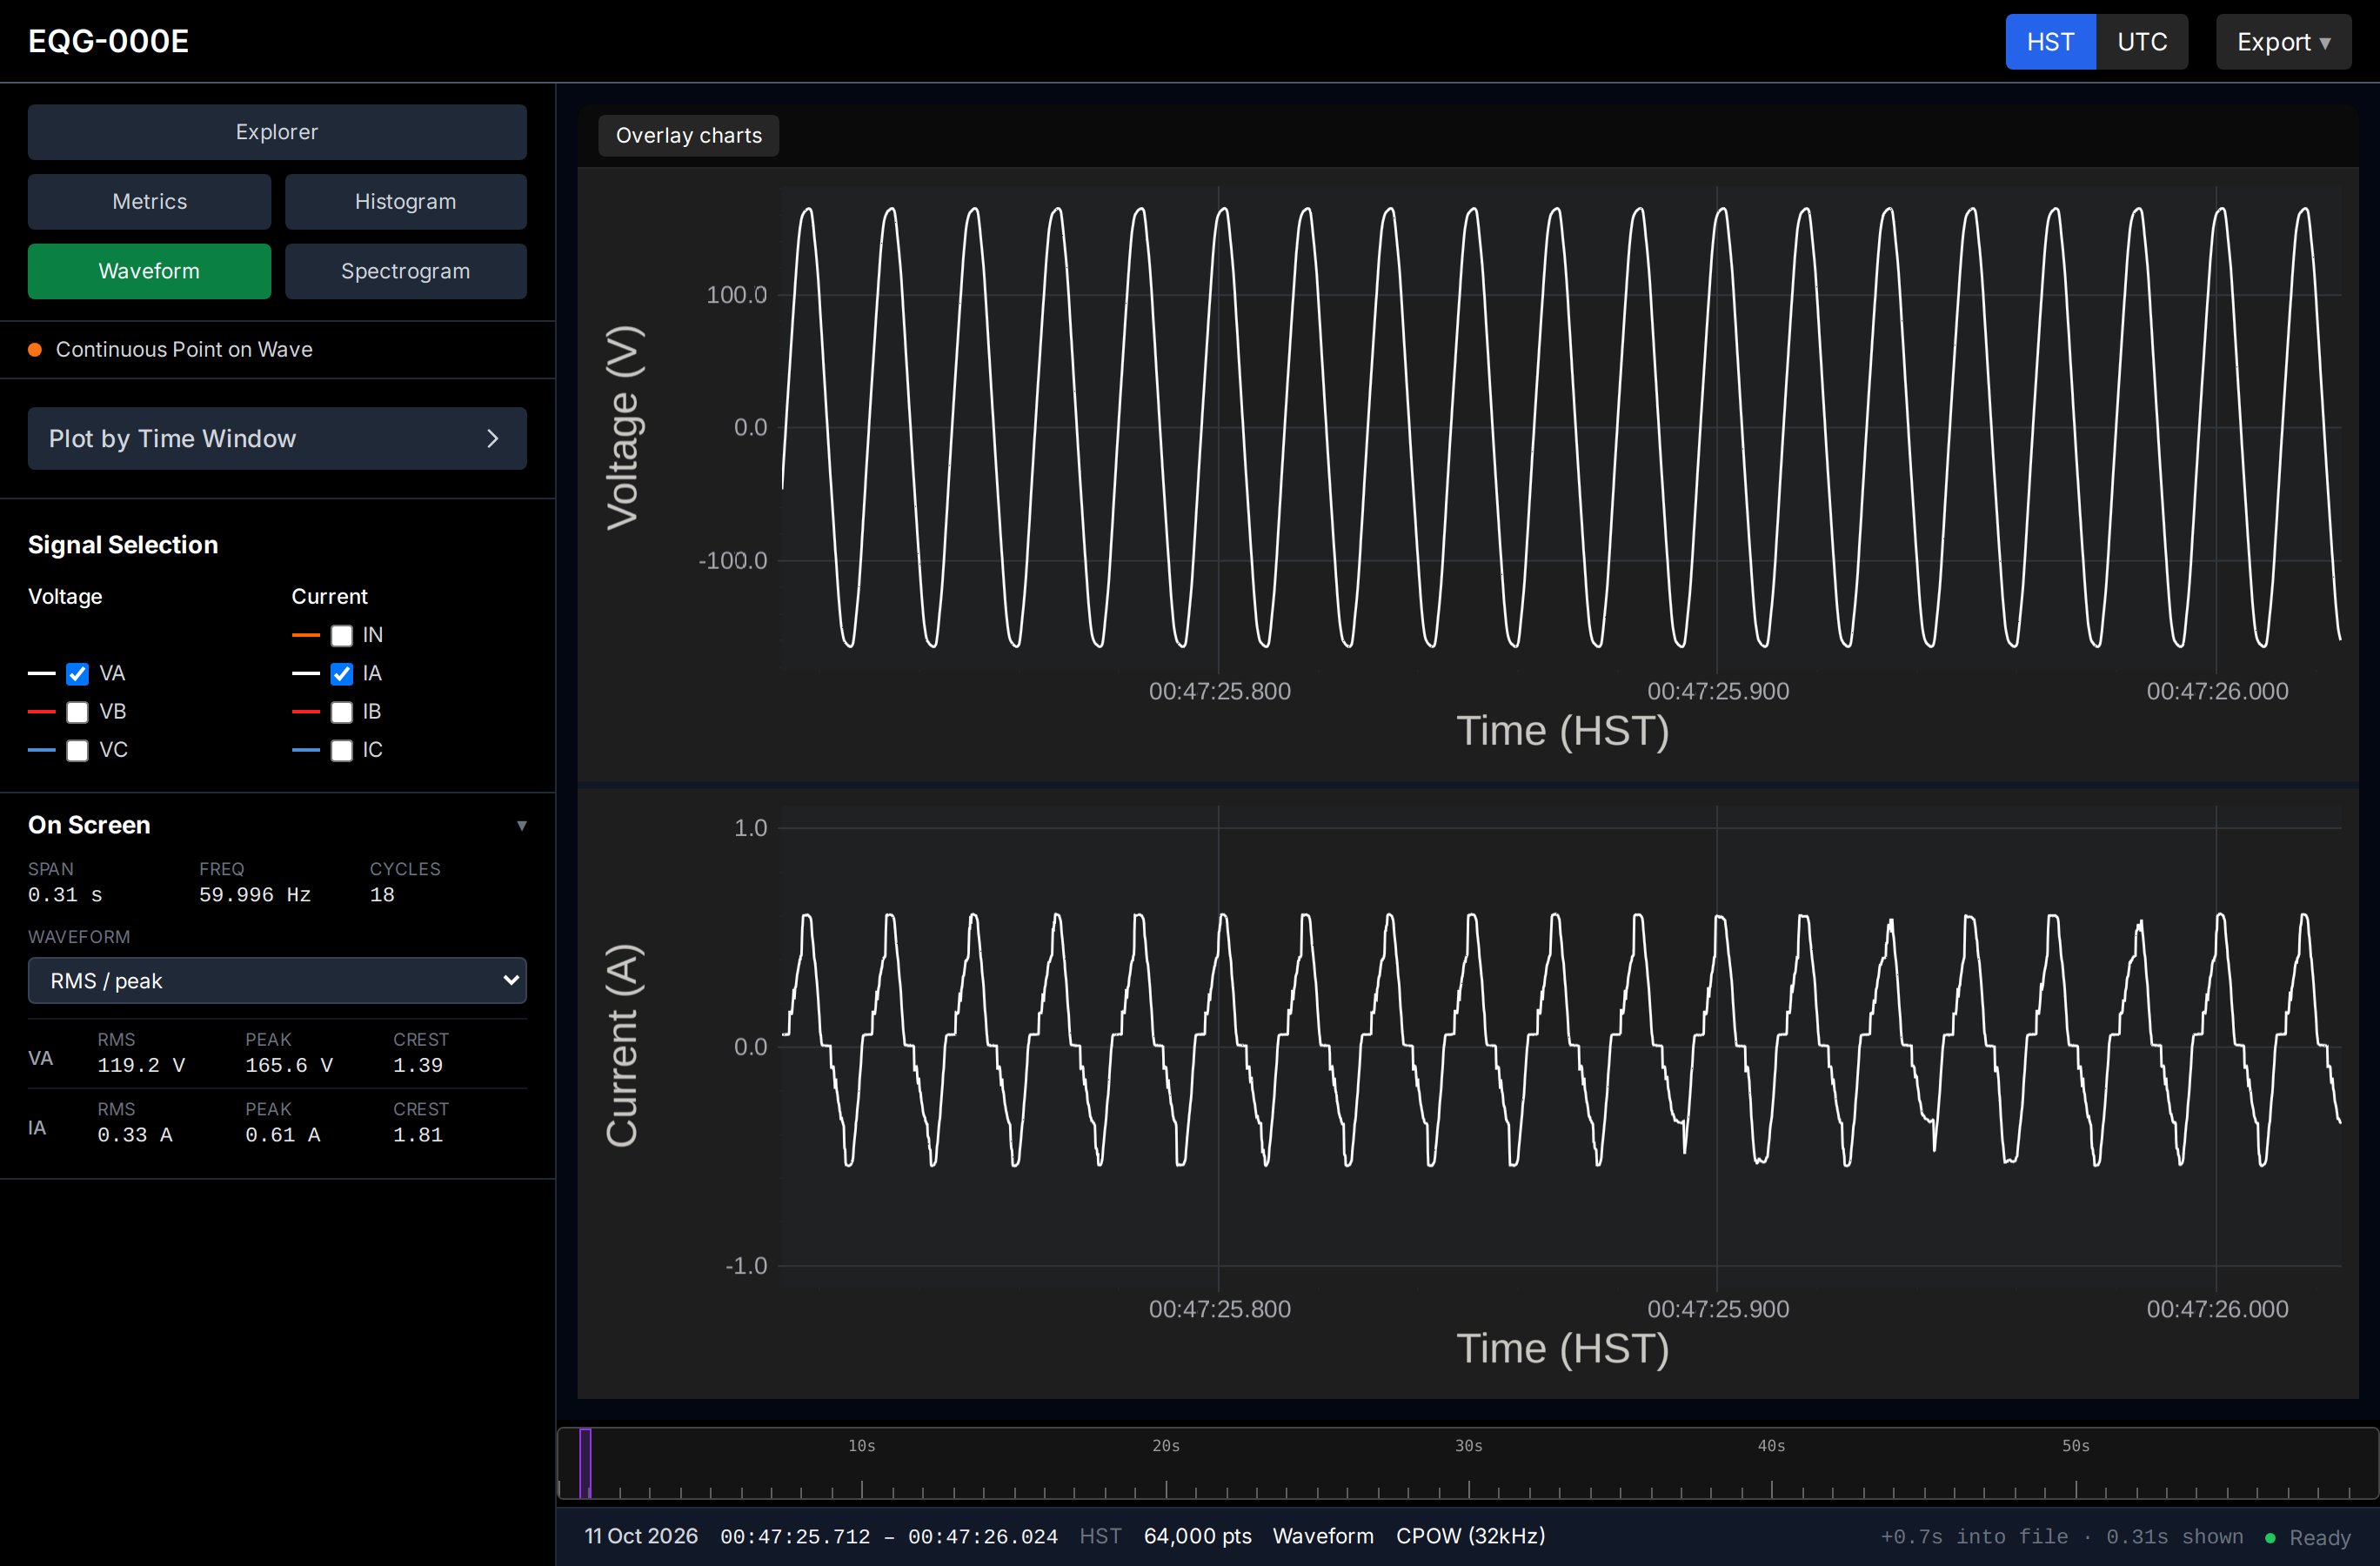
The raw CPOW waveform, voltage above and current below. Signal Selection chooses channels, including the neutral current (IN). Plot by Time Window loads a specific stored capture, and the strip under the chart moves through the loaded file. The On Screen panel reports the span, frequency and cycle count in view, with RMS, peak and crest factor per channel.
Spectrogram
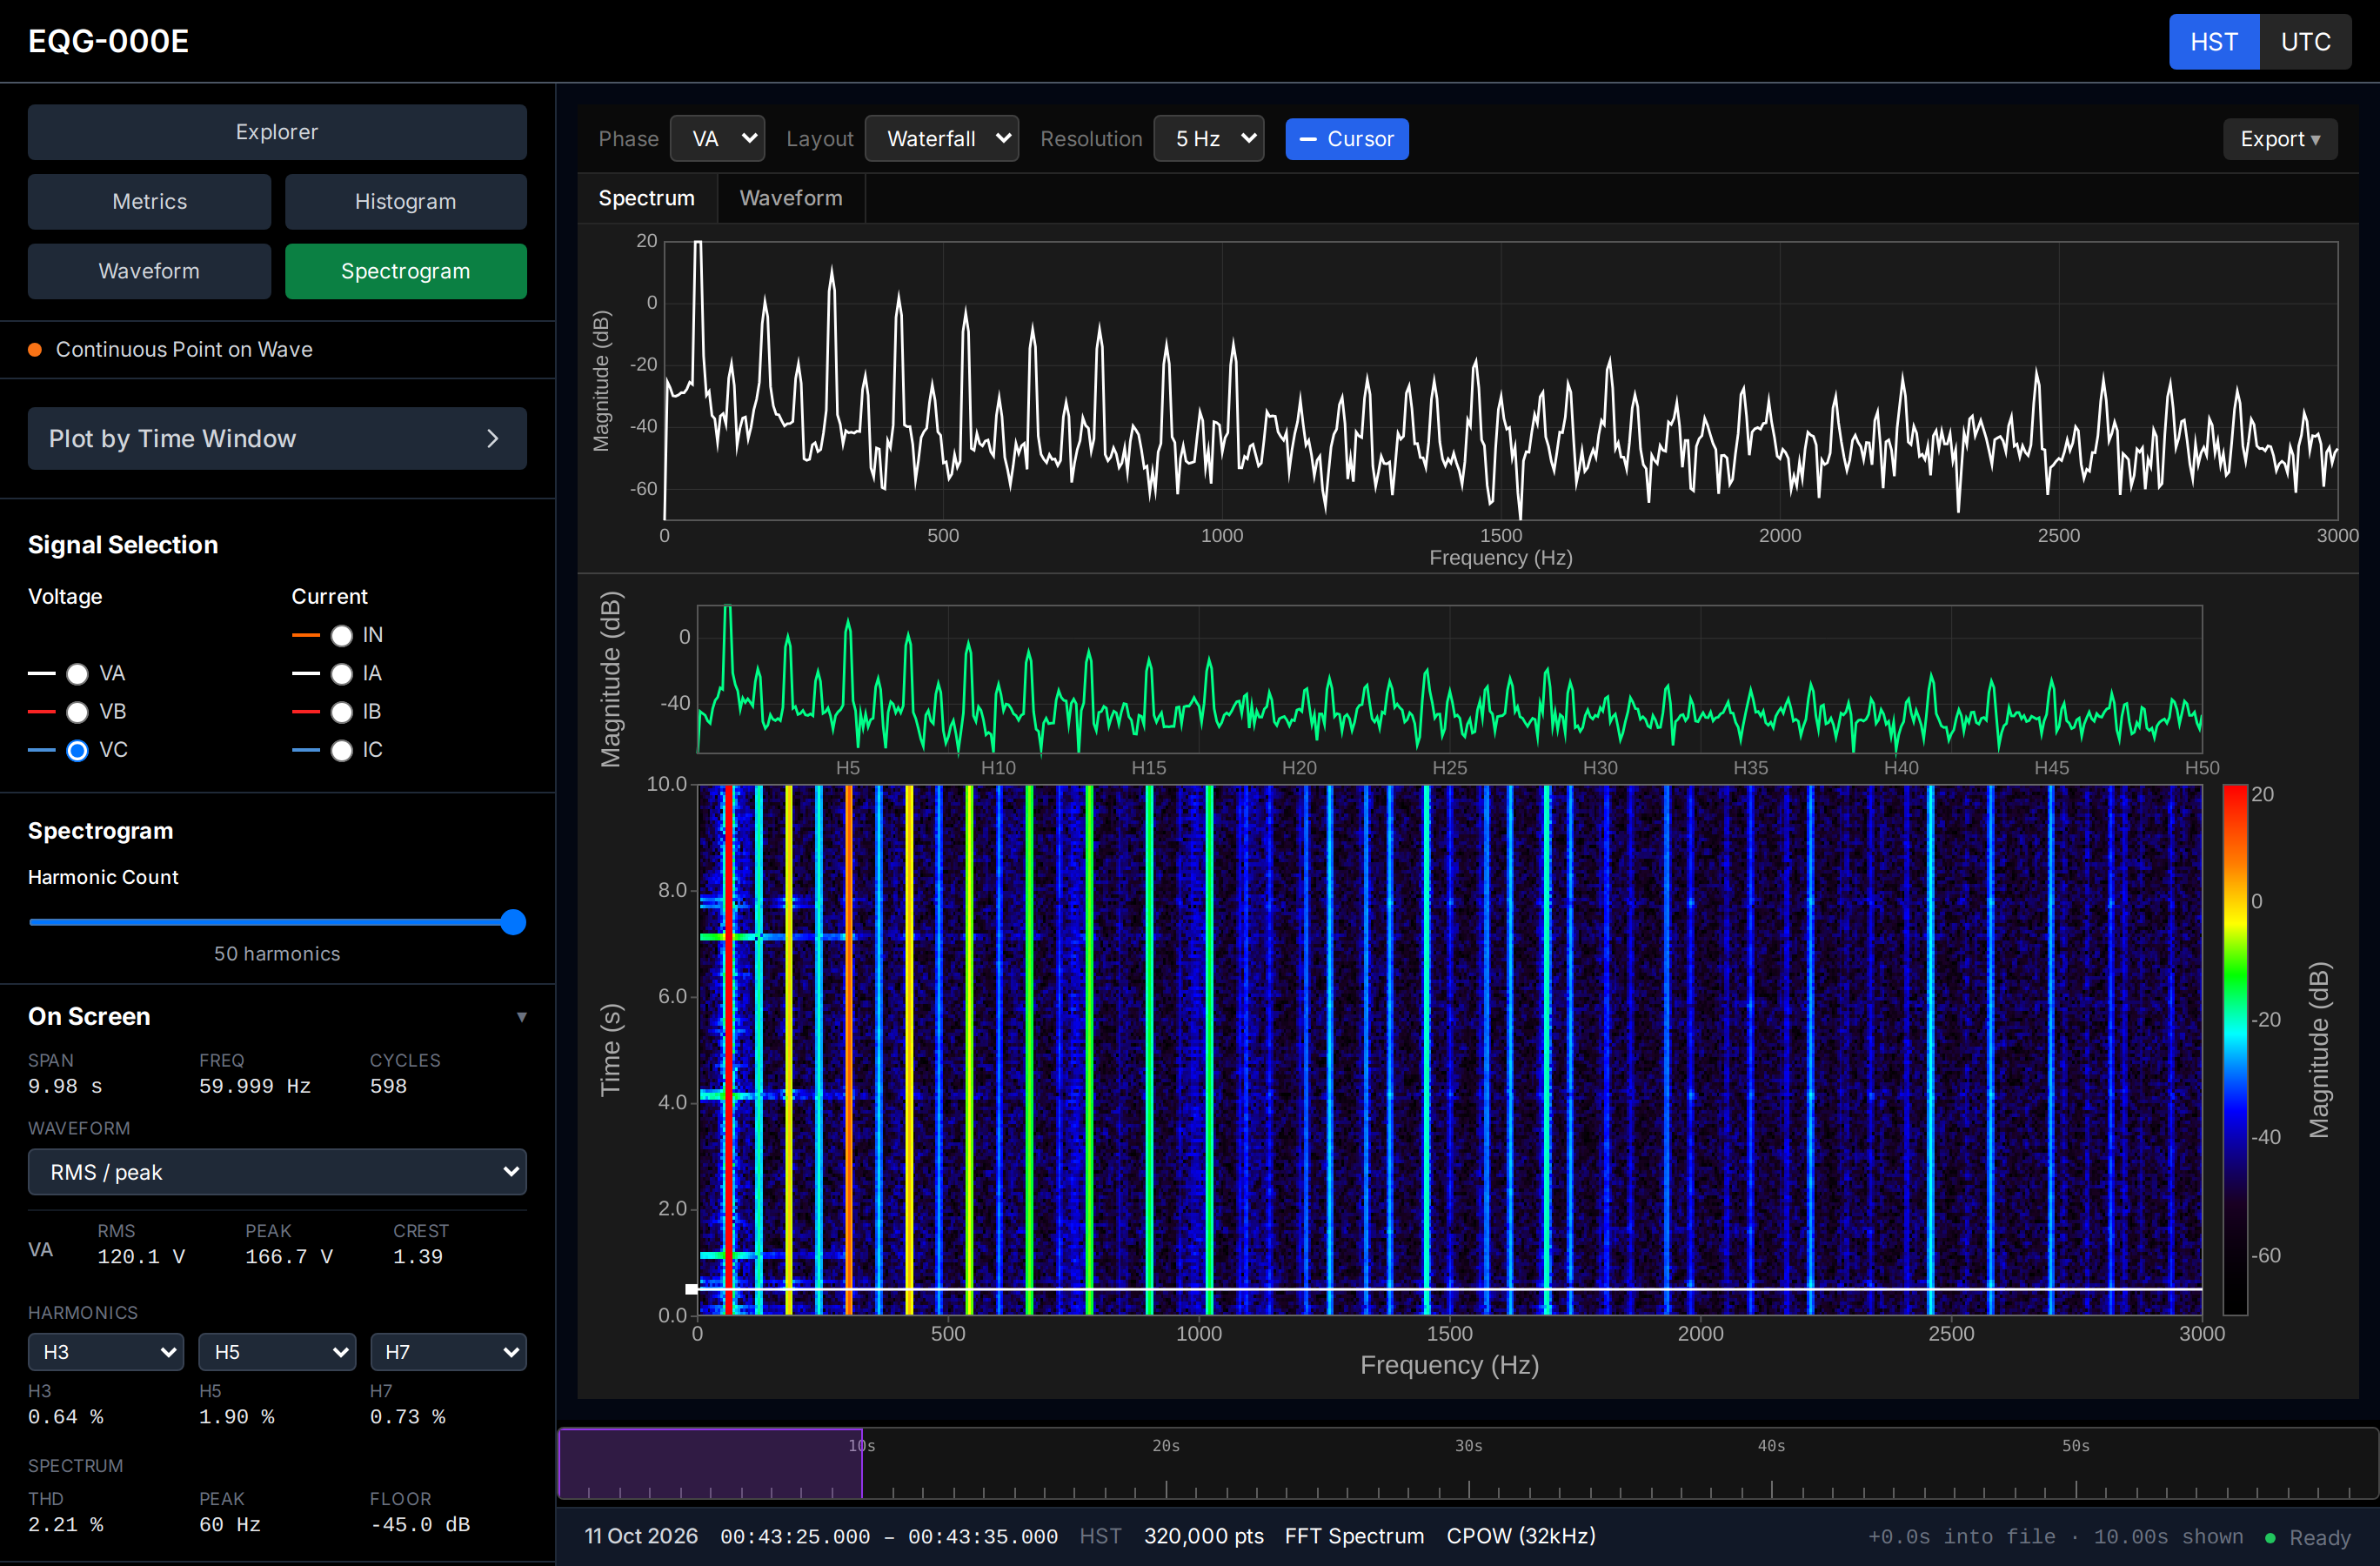
Frequency content of one CPOW channel over the loaded window: a spectrum, a harmonic spectrum, and a waterfall of magnitude in dB. The toolbar selects the channel, layout and frequency resolution, and Cursor reads values at a point. Harmonic Count sets how many harmonics are shown (up to the 50th). The On Screen panel adds selected harmonic levels, THD, the dominant frequency and the noise floor.
Channel Colors
Phase A is white, phase B red, phase C blue, and the neutral current (IN) purple in the live instruments and orange in the analysis views.