EQ Sight — Dashboard
The Dashboard is the landing page in EQ Sight, opened from the EQ icon at the top of the sidebar. It summarizes the site’s supply and loads from the gateway’s live metrics stream.
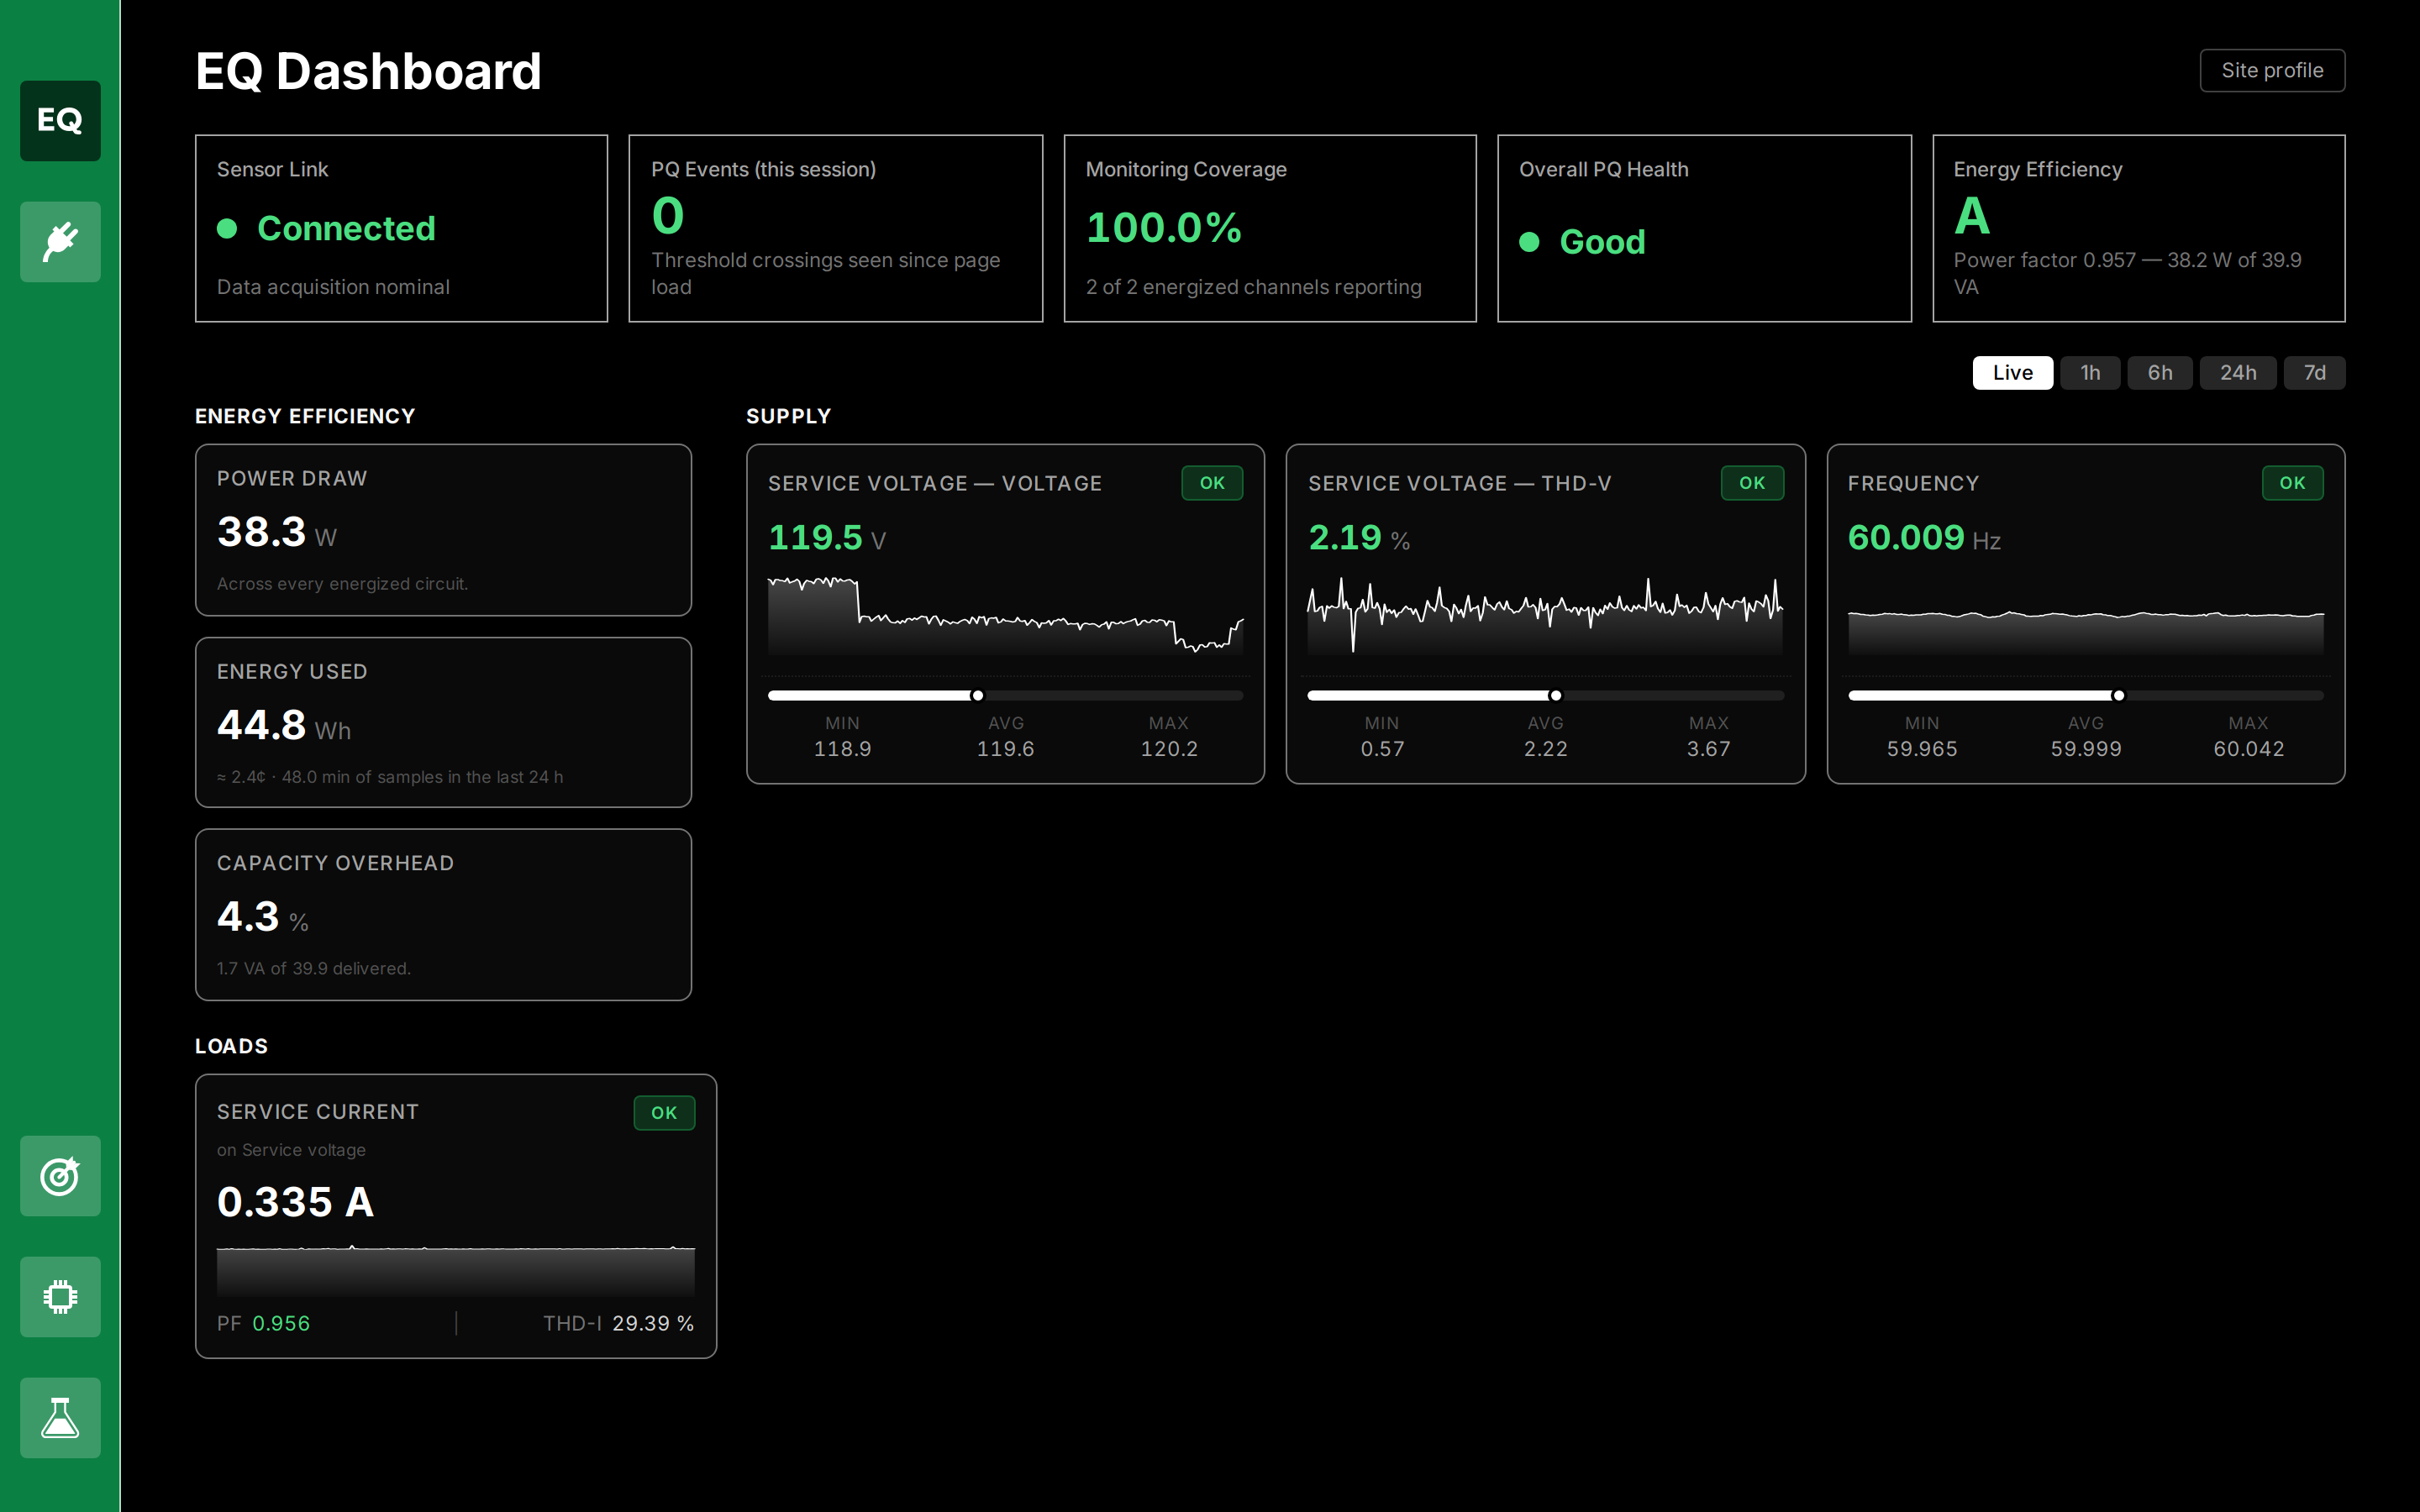
The supply nodes and loads shown are defined by the gateway’s site profile. Site profile (top right) opens a read-only description of the installation: its nominal voltage and frequency, and which channel measures each node and load.
Status Cards
| Card | Shows |
|---|---|
| Sensor Link | Whether the EQ Wave sensor is connected and data is current. Stale or Disconnected is followed by the age of the newest sample. |
| PQ Events (this session) | Threshold crossings observed since the page was opened. The count resets when the page reloads. |
| Monitoring Coverage | Share of energized channels that reported over the last 10 minutes. A de-energized line is left out rather than counted as missing. |
| Overall PQ Health | The worst status across the graded checks below, naming the check that set it. |
| Energy Efficiency | A letter grade for the site’s true power factor (real power over apparent power, energized circuits only): A ≥ 0.95, B ≥ 0.90, C ≥ 0.85, D ≥ 0.80, F below. |
Time Window
The Live / 1h / 6h / 24h / 7d selector sets the window of the trend strips and their min/avg/max figures. Live (the default) follows the most recent five minutes. Energy Used integrates over 24 hours for every selection except 7d, which integrates over seven days.
Energy Efficiency
- Power Draw: real power summed over every energized circuit, in W.
- Energy Used: energy over the window above, with an estimated cost at the rate noted on the tile.
- Capacity Overhead: the share of delivered apparent power that does no work (1 − power factor), in VA and percent.
Supply
One tile per measured quantity at each supply node: RMS voltage, voltage distortion (THD-V), and system frequency. Each tile shows the present value, a trend strip, and min/avg/max over the window, with a status badge:
| Check | OK | Warning | Alarm |
|---|---|---|---|
| Voltage | within ±5% of nominal | within ±10% | beyond ±10% |
| THD-V | below 5% | below 8% | 8% or more |
| Frequency | within ±0.5 Hz | within ±1.0 Hz | beyond ±1.0 Hz |
Loads
One tile per load current, with power factor and current distortion (THD-I). Power factor is graded (OK above 0.95, Warning from 0.90) once the load draws at least 0.05 A; below that the tile reads Idle and power factor is not assessed. THD-I is shown for reference and is not graded, since distortion becomes a power quality problem through the voltage distortion it causes, which the Supply tiles grade.